Share Status Chart by Country – Pie Chart for Market Analysis
RJ0900017_19
- Last Update 08/20/2025
- File Size 0.9MB
- # of Slides 2
- File Format PPTX
- Slide Ratio 16:9
- Color
Keywords
About the Product
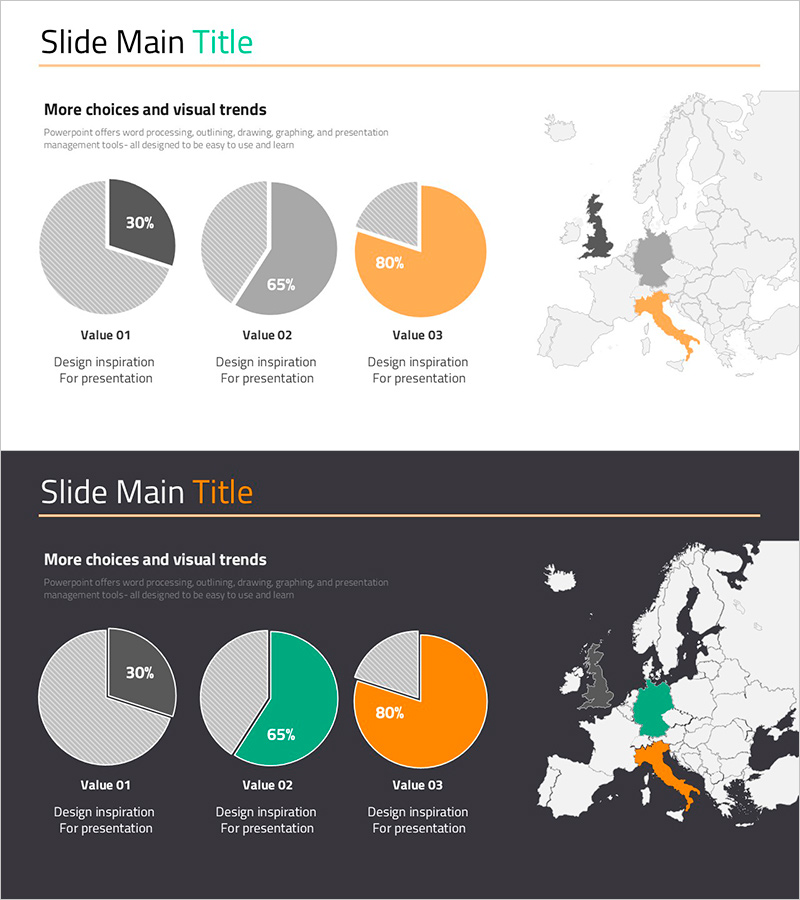
A PowerPoint slide template designed to visualize market share distribution across countries and regions using three-segment pie charts. The design combines gray and orange color accents to highlight data comparisons effectively. Paired with a European map slide, this template enables simultaneous presentation of regional market status and geographic distribution. Ideal for international marketing reports, business analysis presentations, and competitive landscape reviews. Delivered in 16:9 widescreen format with 2 slides ready for immediate editing and deployment.
Usage Points
-
Main Usage
Display market share, sales distribution, or customer concentration across three countries or regions using pie charts, while simultaneously showing geographic context through a regional map. Supports data-driven decision-making in marketing analysis, business performance reporting, investor presentations, and competitive positioning discussions.
-
How to Use
Enter market share percentages and country/region names into the three pie charts on slide 1, then update corresponding legend labels. On slide 2, highlight relevant countries or regions on the map using the provided color scheme. All text, numbers, and colors are fully editable using standard PowerPoint tools without requiring design software.
-
Recommended For
Marketing managers, sales directors, business analysts, international business professionals, market research specialists, and executives presenting regional performance, global expansion strategies, or competitive market analysis. Particularly effective for quarterly business reviews, investor relations presentations, and strategic planning meetings.
-
Slide Structure
Slide 1: Three pie charts (sample data: 30%, 65%, 80%) with descriptive text areas for each segment. Slide 2: European map with three highlighted countries/regions in gray, orange, and black with legend. 16:9 widescreen format, 2-slide set.
Related Products
-

Colors Theme Presentation Template - Map & Donut Chart
#Market and Competitor Analysis #Graph #Market Share
-

Target Area Market Share Analysis Graph – Emphasizing Market Competition
#Market and Competitor Analysis #Graph #Other
-

Medical Development Status Pie Chart – Visualizing Market Share
#Product/Service Introduction #Market and Competitor Analysis #Graph
-

Market Share Pie Chart – Visual Data Analysis
#Market and Competitor Analysis #Graph #Market Share
