Table Chart on Concrete Background – Data Analysis and Visualization
RJ0900014_19
- Last Update 08/20/2025
- File Size 4.6MB
- # of Slides 2
- File Format PPTX
- Slide Ratio 16:9
- Color
Keywords
About the Product
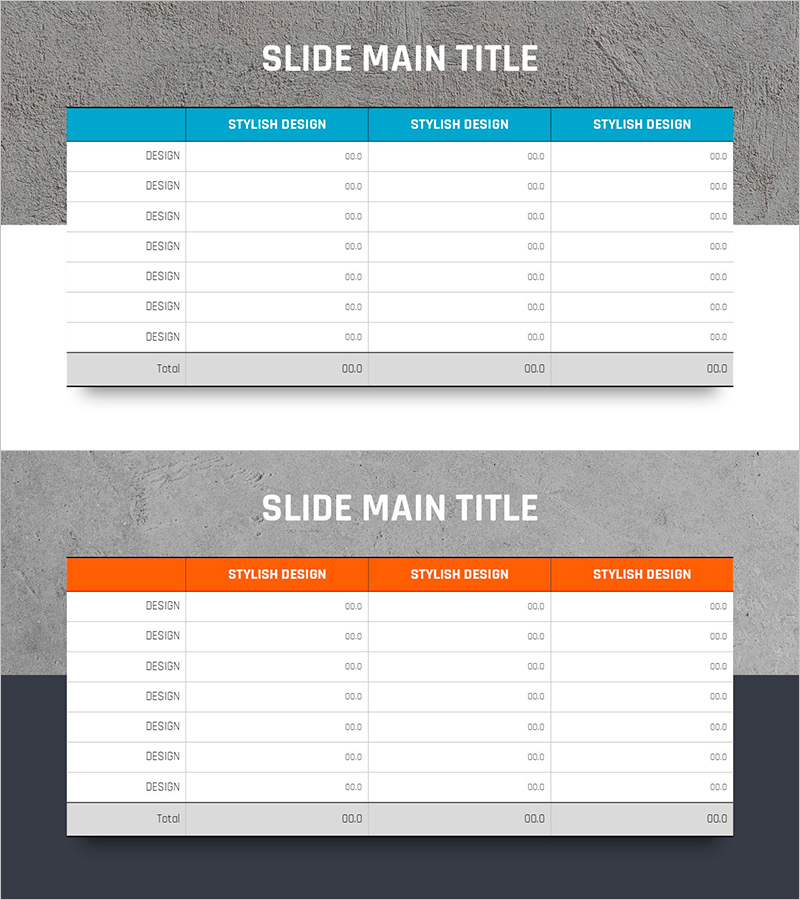
A 2-slide PowerPoint template featuring a data table chart on a concrete texture background. The design combines a light gray concrete backdrop with a blue header row and white data cells arranged in a 3-column structure, enabling clear organization of numerical data and category information. Each row contains a 'Design' label and numeric data fields in '00.0' format, with a 'Total' row at the bottom for summary values. This table layout is ideal for financial reports, performance dashboards, sales analysis, and quantitative metrics in business presentations. The PPTX format allows immediate editing, with full flexibility to modify background colors, header styling, and cell formatting to match your brand guidelines.
Usage Points
-
Main Usage
Present quantitative data and numerical information in an organized table format for reports, analysis documents, and financial presentations. The concrete background conveys industrial credibility and objectivity, while the blue header visually separates the data area for improved readability.
-
How to Use
Enter item names in the 'Design' cells of each row and input numerical values in the three right-hand columns. Add totals in the 'Total' row to provide an at-a-glance summary. Customize by changing the header blue to your corporate brand color or replacing the concrete background texture with an alternative design.
-
Recommended For
Finance teams presenting quarterly earnings reports, marketing teams analyzing campaign performance, sales teams showcasing revenue figures, and executives reviewing KPI dashboards. Suitable for data-driven B2B presentations, internal reporting meetings, and stakeholder briefings requiring quantitative evidence.
-
Slide Structure
Two-slide set with each slide containing a title area at the top and a 3-column × 7-row data table (plus Total row) below. The table header features a blue background with white text, while data cells use white backgrounds with gray text. A concrete texture background frames the entire slide composition.
Related Products
-

Presentation Template for Business Strategy Using Arrow Diagram
#Business Strategy #Operational Plan #Diagram
-

Online Presentation Template Diagram7 – Visualizing Business Strategy
#Business Strategy #Diagram #Business Direction
-

Business Forest Wide Template Diagram2 – Flowchart for Market Strategy
#Marketing Plan and Strategy #Diagram #Target Market Strategy
-

F&B Menu PowerPoint Slide – Circular 4-Step Process Layout
#Operational Plan #Diagram #Business Processes
