Strategic Schemes Free Circle Diagram – Clear Visual Structure
RJ0900007_29
- Last Update 08/17/2025
- File Size 0.1MB
- # of Slides 2
- File Format PPTX
- Slide Ratio 16:9
- Color
Keywords
About the Product
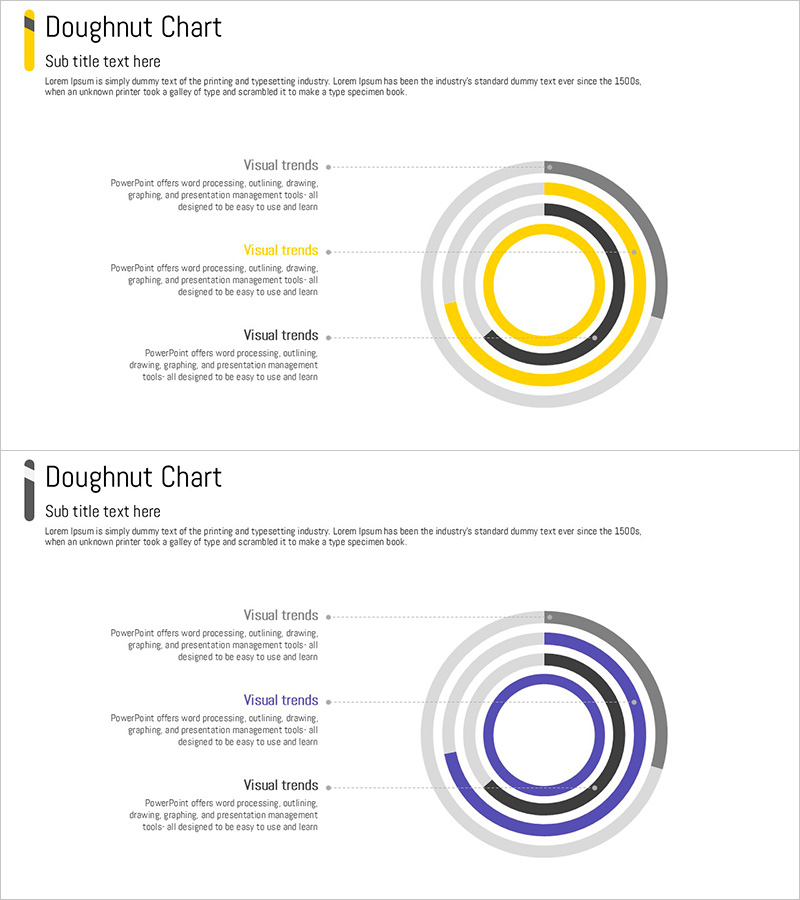
A multi-layer donut chart PowerPoint slide featuring three concentric circles for hierarchical data representation. The layout combines a left text area with a right-aligned chart section, using yellow, black, and gray color schemes for emphasis and neutrality. Each layer accommodates three data points, making it ideal for comparative analysis across multiple dimensions. Perfect for presentations, reports, and strategic proposals that require intuitive visualization of complex compositional data. The 2-slide set includes color variations (yellow and blue) to match your document's visual identity.
Usage Points
-
Main Usage
Designed to represent compositional data with layered proportions across multiple dimensions. Ideal for market share analysis, organizational structure, budget allocation, customer segmentation, and any scenario requiring clear visualization of hierarchical relationships.
-
How to Use
Enter layer-specific descriptions or legends in the left text area and input numerical data into the concentric donut chart on the right. Use color emphasis to highlight key items and present layer-by-layer explanations aligned with your presentation flow.
-
Recommended For
Strategy, planning, marketing, and finance professionals presenting multi-dimensional data analysis to executives, clients, or teams. Suitable for business reports, investment proposals, marketing strategy presentations, organizational structure explanations, and any complex information delivery scenario.
-
Slide Structure
2-slide set with consistent layout: left text area (space for 3 item descriptions) paired with a right-aligned 3-layer concentric donut chart. Slide 1 features yellow, black, and gray; Slide 2 offers blue, black, and gray—select based on your document's color scheme.
Related Products
-

Problem Solving Diagram – Business Support Strategy
#Operational Plan #Diagram #Mitigation Measures
-

Marketing Strategy Overview - Clear Communication of Business Strategies
#Business Vision and Strategy #Diagram #Business Strategy
-

Eco Service Development Status Diagram
#Product/Service Introduction #Diagram #Composition
-

Global Service Characteristics Diagram – Effective Product Presentation
#Product/Service Introduction #Diagram #Product/Service Introduction
