Building Safety Square Diagram – Visualizing Features and Functions
RJ0900007_15
- Last Update 08/17/2025
- File Size 0.1MB
- # of Slides 2
- File Format PPTX
- Slide Ratio 16:9
- Color
Keywords
- #Content-Based Slides
- #Design-Based Slides
- #Product/Service Introduction
- #Diagram
- #Features
- #Program Introduction
- #Spread
- #Decentralized Diagram
- #16:9
- #square diagram PowerPoint
- #4-section diagram slide
- #building safety presentation
- #feature explanation diagram
- #quadrant layout PPT
- #business presentation template
About the Product
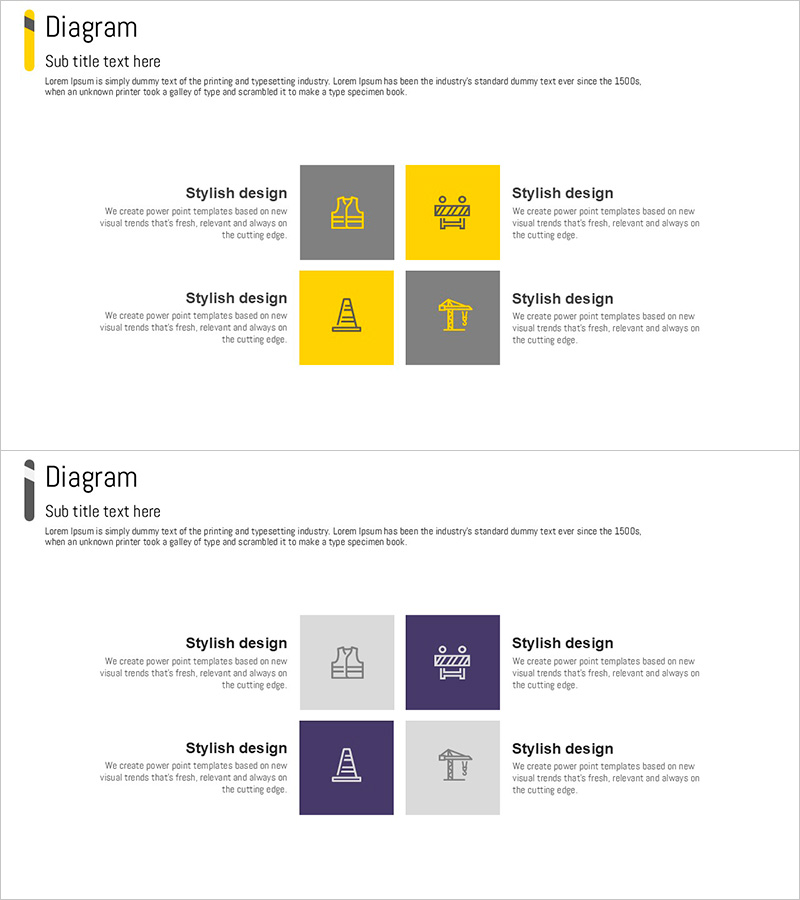
A PowerPoint slide that visualizes building safety functions and characteristics across four equal sections using a balanced square layout. The design features a striking contrast between yellow and gray tones, with centered icons and text areas for each section. This diagram slide is ideal for construction safety training, product feature presentations, and program overviews. The 2-slide set includes layout variations to support flexible content arrangement and multiple presentation scenarios.
Usage Points
-
Main Usage
Present four key functions or characteristics of building safety with equal emphasis using a balanced, centerless layout. Each section stands independently while contributing to an integrated concept. Perfect for construction safety briefings, product feature introductions, and program structure explanations.
-
How to Use
Insert icons and text into each square section to represent four main topics. Alternate between yellow highlight areas and gray background areas to create visual rhythm. Select the appropriate layout from the 2-slide set based on your presentation flow and content needs.
-
Recommended For
Construction and building safety professionals, product teams presenting feature sets, educational institutions introducing programs, and consulting firms presenting solutions. Especially effective when four items require equal visual weight and emphasis.
-
Slide Structure
Two-slide set featuring identical 4-section square layouts. Each slide divides the space into four quadrants (top-left, top-right, bottom-left, bottom-right) with alternating yellow and gray sections in a checkerboard pattern. Each section includes dedicated icon and text input areas for customization.
Related Products
-

UX UI Program Introduction Slides – Modern Design and Visual Appeal
#Product/Service Introduction #Diagram #Features
-

Working Holiday & Study Abroad PPT Slide - Education Consulting PowerPoint Template
#Product/Service Introduction #Features #Program Introduction
-

Business Strategy Core Diagram – Efficient and Visual Structure
#Product/Service Introduction #Business Vision and Strategy #Diagram
-

Ringer Shape Subdivided Column Graph for Program Introduction – Clustered Data Visualization
#Product/Service Introduction #Diagram #Features
