Five Color PowerPoint Template – Utilizing Infographic Elements
RJ0200009_14
- Last Update 03/30/2025
- File Size 4.6MB
- # of Slides 2
- File Format PPTX
- Slide Ratio 16:9
- Color
Keywords
- #Content-Based Slides
- #Design-Based Slides
- #Product/Service Introduction
- #Diagram
- #Features
- #Benefits and Advantages
- #Spread
- #Decentralized Diagram
- #16:9
- #overlapping cluster diagram PowerPoint
- #4-circle diagram slide
- #infographic PowerPoint template
- #relationship diagram
- #5-color diagram slide design
About the Product
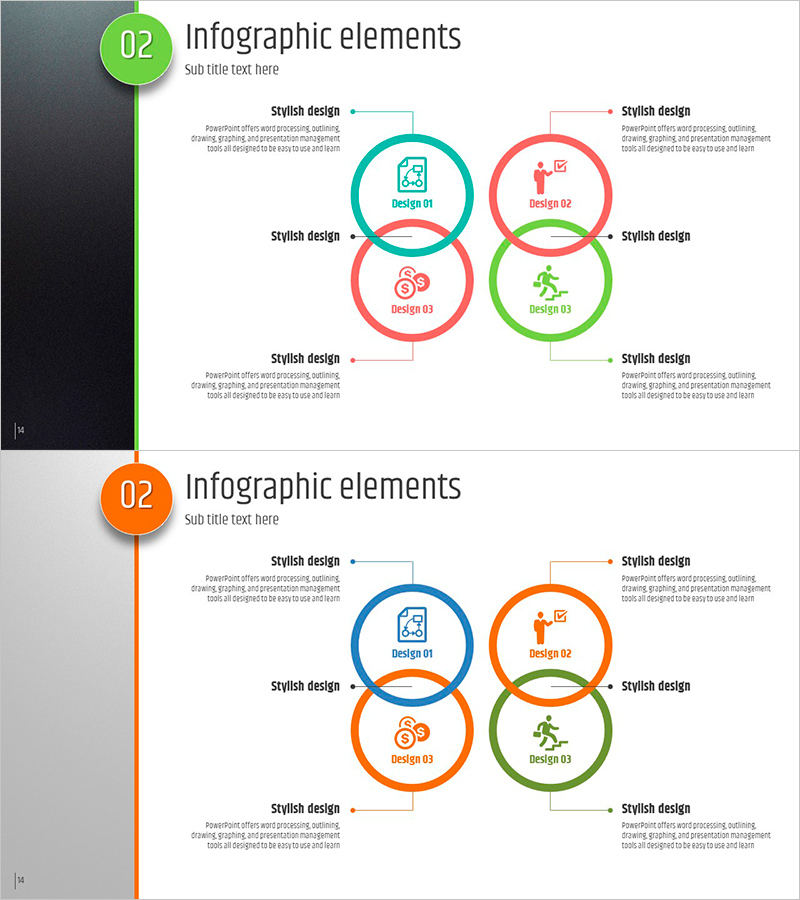
A cluster diagram PowerPoint slide featuring four circular nodes overlapping at the center, utilizing five distinct colors—cyan, pink, red, and green—to differentiate each area. Icons and text fields are integrated to visualize relationships and interactions between concepts. The 2-slide set is ready for immediate use in various presentation scenarios, enabling clear representation of connections between ideas. Provided in 16:9 widescreen PPTX format for seamless integration into your presentations.
Usage Points
-
Main Usage
Ideal for illustrating inter-organizational interactions, process stage connections, and concept relationships. The overlapping circular node structure intuitively conveys hierarchical relationships between core and peripheral elements, while color differentiation simultaneously expresses both independence and connectivity of each area.
-
How to Use
Input relevant topics into the icon and text areas of each circular node, then emphasize relationships using arrows and connector lines. Applicable to organizational structure presentations, marketing channel integration, technology stack relationships, customer journey mapping, and various other business contexts.
-
Recommended For
Suitable for executive reports, organizational restructuring announcements, marketing strategy presentations, technology architecture explanations, and business model introductions. Effective for strategy planning teams, marketing departments, IT teams, and consulting firms explaining complex relationships in simplified form.
-
Slide Structure
2-slide set with the first slide featuring a green left sidebar and four overlapping circular nodes, and the second slide with an orange left sidebar in identical layout. Each slide comprises four color-coded nodes (cyan, pink, red, green) and eight text input areas, optimized for 16:9 widescreen format.
Related Products
-

3D Box Diagram – Highlighting Product Features and Benefits
#Product/Service Introduction #Diagram #Features
-

Centerless Diffusion Diagram Using Colored Pencils
#Product/Service Introduction #Diagram #Features
-

Overview of Major Organs and Their Functions – Visualized Infographic
#Product/Service Introduction #Diagram #Other
-

Four Color Infographic Presentation Template – Product and Service Introduction
#Product/Service Introduction #Diagram #Product/Service Introduction
