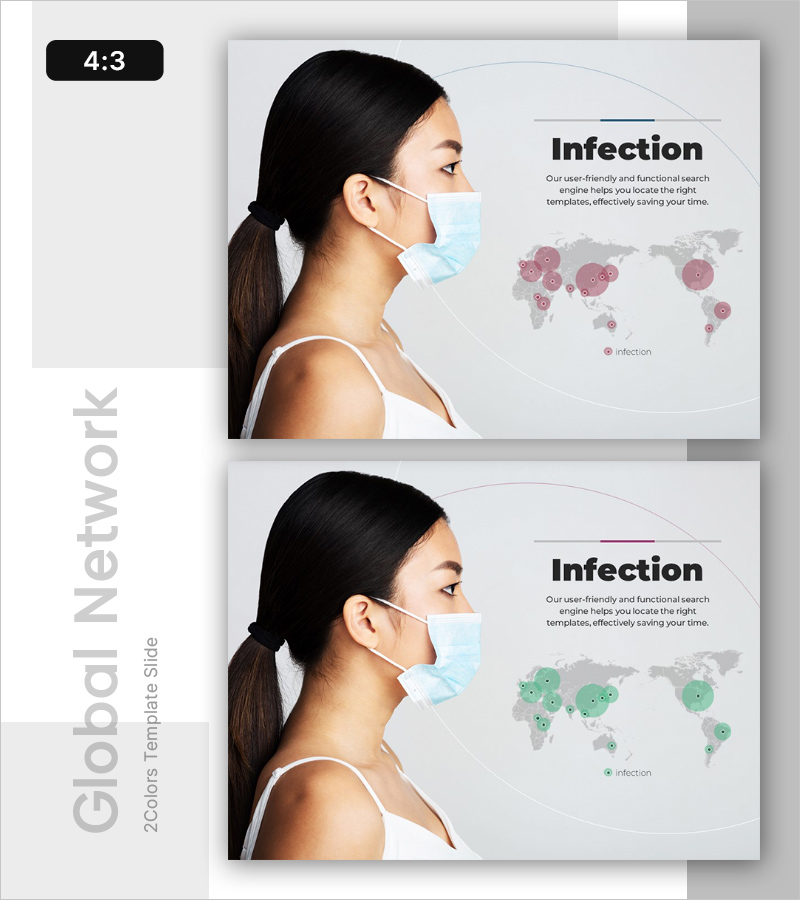
Visual Analysis Slide on Spread of Infection – Through Global Network
RL0100093_2
- Last Update 01/23/2025
- File Size 4.2MB
- # of Slides 2
- File Format PPTX
- Slide Ratio 4:3
- Color
Keywords
About the Product
A 2-slide PowerPoint set for visually analyzing global infection spread patterns. Designed with a light gray background, featuring a masked person photograph and a world map with infection distribution represented by circular charts. The layout comprises three sections: title area at the top, descriptive text space on the right, and geographic visualization at the bottom. Includes pink and green color versions in 4:3 ratio PPTX format, ready for immediate editing. Ideal for risk management, market analysis, and strategic presentations.
Usage Points
-
Main Usage
Presents global-scale infection spread data through geographic and statistical analysis. The world map with circular charts enables quick regional comparison of infection magnitude, emphasizing spatial distribution of risk factors.
-
How to Use
Apply to company risk management reports, market analysis presentations, and strategy meeting materials. Edit title and description text to adapt for various risk analyses including disease, disaster, or pandemic scenarios. Select color version to match presentation tone.
-
Recommended For
Healthcare and pharmaceutical executives, insurance risk analysts, government policy makers, management consultants, and academic presenters who need to visually communicate global risk assessments and geographic spread patterns.
-
Slide Structure
Two-slide format with consistent layout: title section (Infection) at top, person photo plus descriptive text on right side, and world map with circular chart visualization at bottom. Pink and green color variants provided for flexible presentation contexts.


