Visual Slide for Global Real Estate Market Survey
RJ0900002_27
- Last Update 08/16/2025
- File Size 0.5MB
- # of Slides 2
- File Format PPTX
- Slide Ratio 16:9
- Color
Keywords
- #Content-Based Slides
- #Design-Based Slides
- #Company Introduction
- #Marketing Plan and Strategy
- #Other
- #Global Network
- #Target Market Strategy
- #16:9
- #global market analysis PowerPoint
- #world map presentation slide
- #market research visualization
- #country data comparison
- #international business PPT template
About the Product
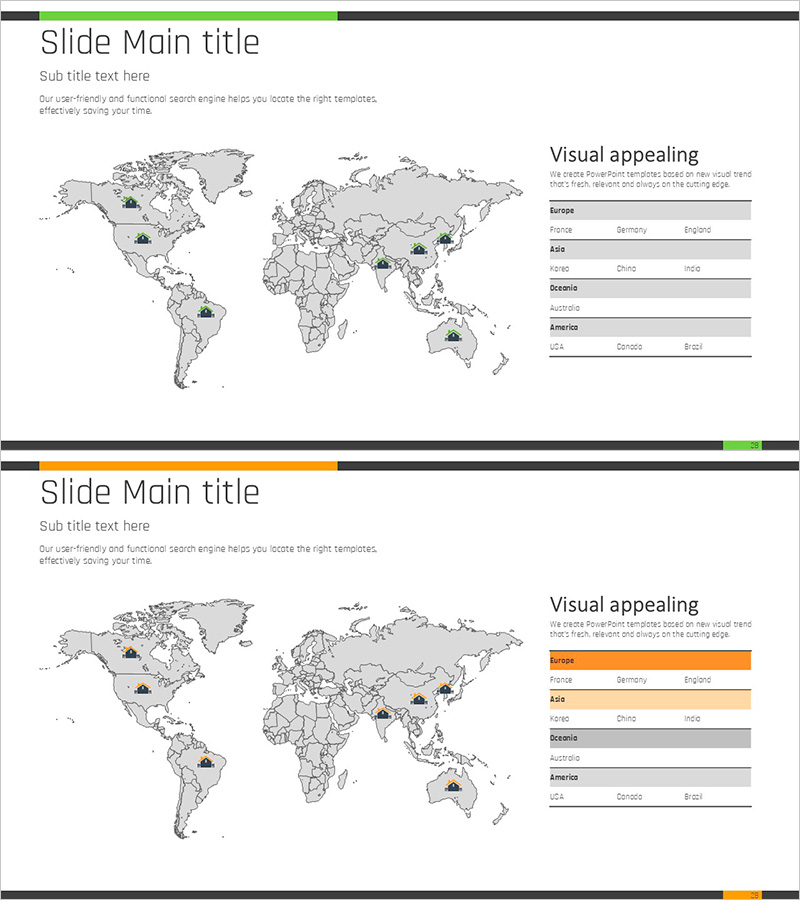
A PowerPoint slide designed to visualize global real estate market surveys and country-by-country market conditions. This two-slide set features a world map with regional markers on the left and a data table displaying country and regional information on the right, ready for immediate use in international market analysis presentations. Available in two color versions—green and orange—allowing you to match your corporate brand guidelines. The clear separation between text and table areas makes data entry straightforward. Optimized for real estate, finance, and consulting industries presenting market strategies, investor briefings, and marketing plans.
Usage Points
-
Main Usage
Communicate international market conditions, real estate surveys, and global business strategies through map-based visualization, establishing clear decision-making foundations. The combination of regional markers and data tables transforms complex market information into intuitive visuals, building credibility in presentations to investors, partners, and executives.
-
How to Use
Modify map markers to target countries and regions, then populate the right-side table with specific market data such as market size, growth rates, and competitive landscape. Select either the green or orange color version to align with your corporate brand guidelines, update the title and subtitle to match your presentation topic, and deploy immediately.
-
Recommended For
Ideal for real estate, finance, consulting, trade, and international business professionals presenting global market entry strategies, investment feasibility assessments, and competitive analyses. Also effective in marketing plans, business proposals, and investor relations materials when explaining regional opportunities and risks in the market analysis section.
-
Slide Structure
Slide 1: Title and subtitle area + world map with eight regional markers + right-side data table with three columns (region, country, metrics). Slide 2: Identical layout in alternate color version (orange accent). Each slide comprises two text input areas, one map area, and one table area with clear information hierarchy.
Related Products
-

Global Marketing Strategy with World Map – Capturing Target Markets
#Company Introduction #Marketing Plan and Strategy #Other
-

Global Photo Shoot Spots Map – Visual Material Supporting Effective Marketing Strategies
#Company Introduction #Marketing Plan and Strategy #Diagram
-

Global Target Regional Goals – Visualizing Marketing Strategies and Clusters
#Company Introduction #Marketing Plan and Strategy #Diagram
-

Global Target Market Strategy – Visualized Data
#Company Introduction #Marketing Plan and Strategy #Graph
