Continuous Exercise Results Analysis Graph – Competitive Market Analysis
RL0100091_3
- Last Update 01/23/2025
- File Size 3MB
- # of Slides 2
- File Format PPTX
- Slide Ratio 4:3
- Color
Keywords
About the Product
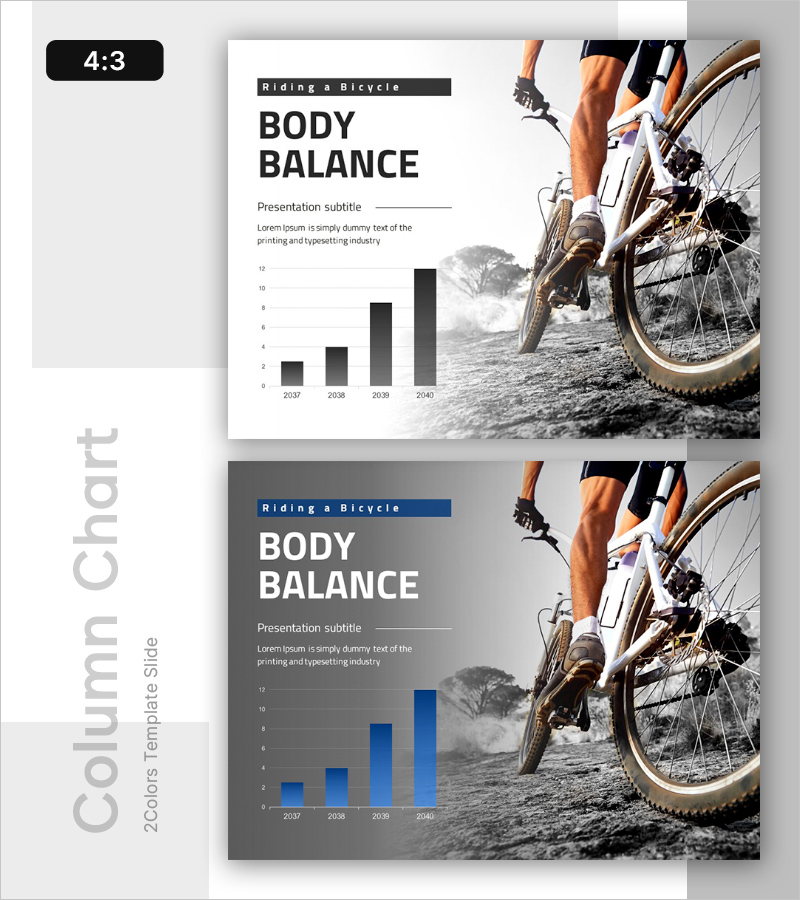
A PowerPoint slide visualizing four years of body balance data collected during bicycle riding activities. The layout combines a title and descriptive text area on the left with an authentic cycling action photograph on the right, while a bar chart at the bottom displays growth trends from 2037 to 2040. The design uses a monochrome background with black bars that stand out clearly, making it ideal for data-driven performance reporting. Available in two color versions (white and dark gray), with 4:3 aspect ratio.
Usage Points
-
Main Usage
Communicates exercise performance, physical indicator changes, and long-term trend data visually. The bar graph clearly expresses annual growth rates, improvement trends, and goal achievement metrics to support decision-making.
-
How to Use
Used in sports science, fitness program evaluation, and health management presentations to report individual or group body balance improvements. Simply edit the title and subtitle, then replace graph values with actual data for immediate use.
-
Recommended For
Sports scientists, fitness trainers, health management professionals, and exercise program development teams presenting performance analysis and improvement results to executives, investors, and clients.
-
Slide Structure
Organized with title area (top left), subtitle and descriptive text (middle left), background image (full right side), and bar graph (bottom center). Features four bars representing four years of data in a simple yet effective comparative layout.


