Food UI PPT Schedule – Infographic Suitable for Business Strategy
RJ0800051_29
- Last Update 08/14/2025
- File Size 0.3MB
- # of Slides 2
- File Format PPTX
- Slide Ratio 16:9
- Color
Keywords
About the Product
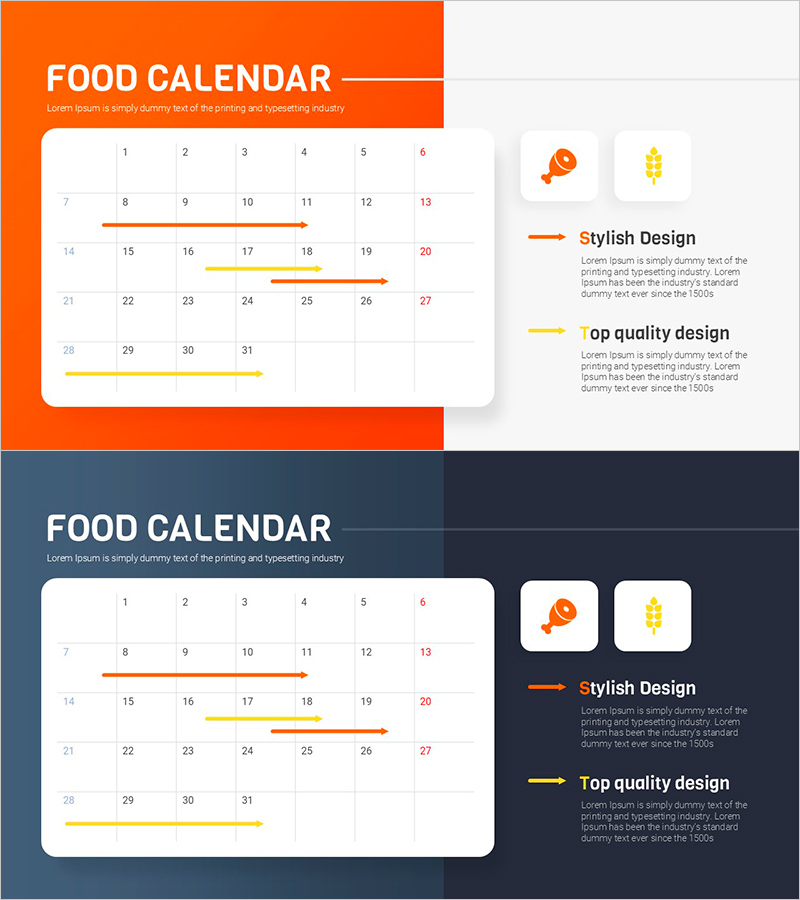
This slide provides a presentation schedule tailored for Food UI, simplifying data visualization. With a vibrant blend of orange and yellow, the stylish design effectively communicates clear business strategies and timelines in presentations. It is optimized for goal-oriented roadmap delivery. This slide allows easy replacement of text and data, making it user-friendly for editing. The editing difficulty is rated as 'easy', enhancing quick application to supplementary presentation materials.
Usage Points
-
Main Usage
- This template is ideal for presentations focused on food industry data, allowing users to effectively convey complex information in a straightforward manner during meetings or conferences.
-
How to Use
- Users can easily adapt the template for various purposes, such as reporting project progress, proposing new initiatives, or sharing insights with colleagues, enhancing communication clarity.
-
Recommended For
- This resource is particularly beneficial for marketing teams, project managers, and food industry professionals who need to present detailed plans and analytics during stakeholder meetings.
-
Slide Structure
- The overall flow consists of an introductory section, followed by detailed timelines and strategies, and concluding with a summary that reinforces key points, suitable for internal reviews or client pitches.
Related Products
-

Gradient Theme Schedule Planner – Business Strategy Tool
#Business Strategy #Business Management #Diagram
-

Data Analysis Schedule – Table for Business Strategy
#Business Strategy #Business Management #Diagram
-

Dawn City Theme Roadmap – Business Strategy
#Business Strategy #Business Management #Diagram
-

Green-Yellow Schedule – Ideal Slide for Strategic Business Planning
#Business Strategy #Business Management #Diagram
