Analysis of Food Ingredients and World Maps – A Taste of Cultures
RJ0800048_18
- Last Update 08/13/2025
- File Size 1.6MB
- # of Slides 2
- File Format PPTX
- Slide Ratio 16:9
- Color
Keywords
About the Product
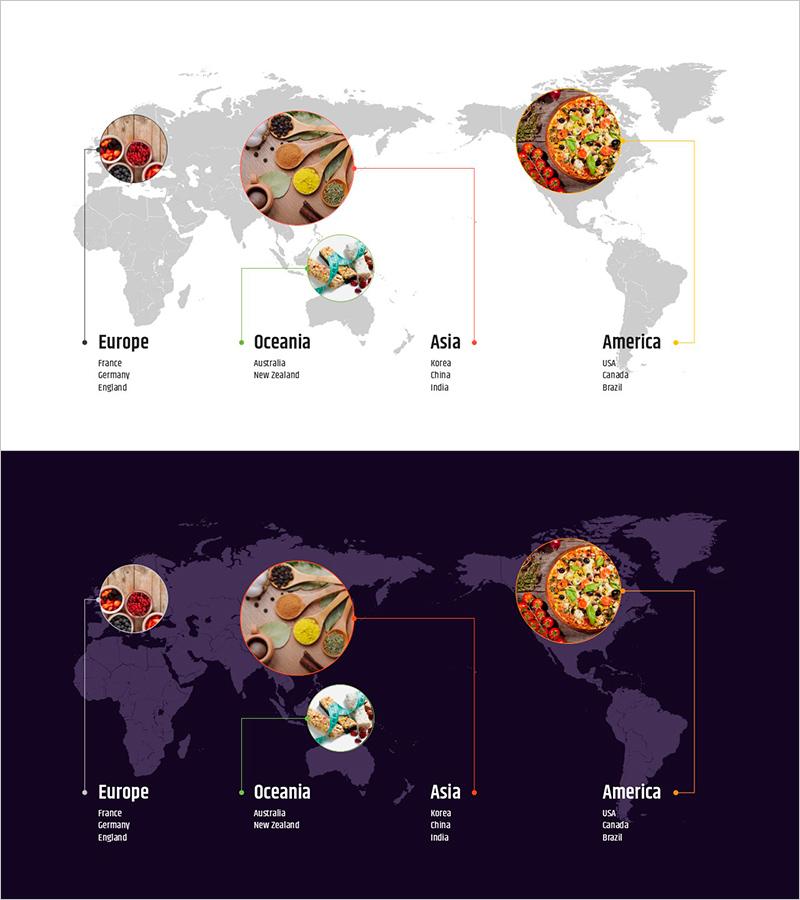
This PowerPoint slide visualizes representative food ingredients from five global regions (Europe, Oceania, Asia, and America) using circular food images and map pins. Two versions are provided with light and dark backgrounds, enabling side-by-side comparison of regional culinary cultures and specialty ingredients at a glance. Country-specific ingredient information is displayed as text labels for presentation reference. Available in 16:9 PPTX format for immediate editing, this slide effectively communicates data-driven comparative analysis across marketing, educational, and cultural presentation contexts.
Usage Points
-
Main Usage
Ideal for global market analysis, cultural research presentations, and food industry discussions where regional ingredient characteristics and differences must be communicated visually. The map-based layout provides geographic context, while circular image placeholders intuitively represent each region's signature foods.
-
How to Use
Hover over or click region pins to display corresponding country names and ingredient details. Edit text boxes to add descriptions or statistical data. Replace circular image areas with your own food photography for customization. Select light or dark background version based on presentation environment and venue lighting.
-
Recommended For
Food and beverage marketing professionals, international business analysts, cultural education instructors, tourism and import-export company staff, global supply chain managers, and researchers presenting regional ingredient sourcing strategies or market entry analysis.
-
Slide Structure
Two-slide deck featuring a world map background with four region pins (Europe, Oceania, Asia, America), 4–5 circular food ingredient images per region, and country name text fields. Geographic information is conveyed through pin placement on the map, while the combination of circular images and text labels creates a clear comparative analysis framework.
Related Products
-

Happy Family Template Cover – Friendly Presentation
#Emotional Messages
-

Successful Competitive Business – A PowerPoint Template for Honor and Achievement
#Emotional Messages
-

Business Goals Diagram – Visualizing Business Vision and Strategy
#Emotional Messages
-

Premium Power Move Ending Cover Template
#Emotional Messages
