Business Goals Diagram – Visualizing Business Vision and Strategy
RL0100001_4
- Last Update 01/18/2025
- File Size 1.2MB
- # of Slides 2
- File Format PPTX
- Slide Ratio 4:3
- Color
Keywords
About the Product
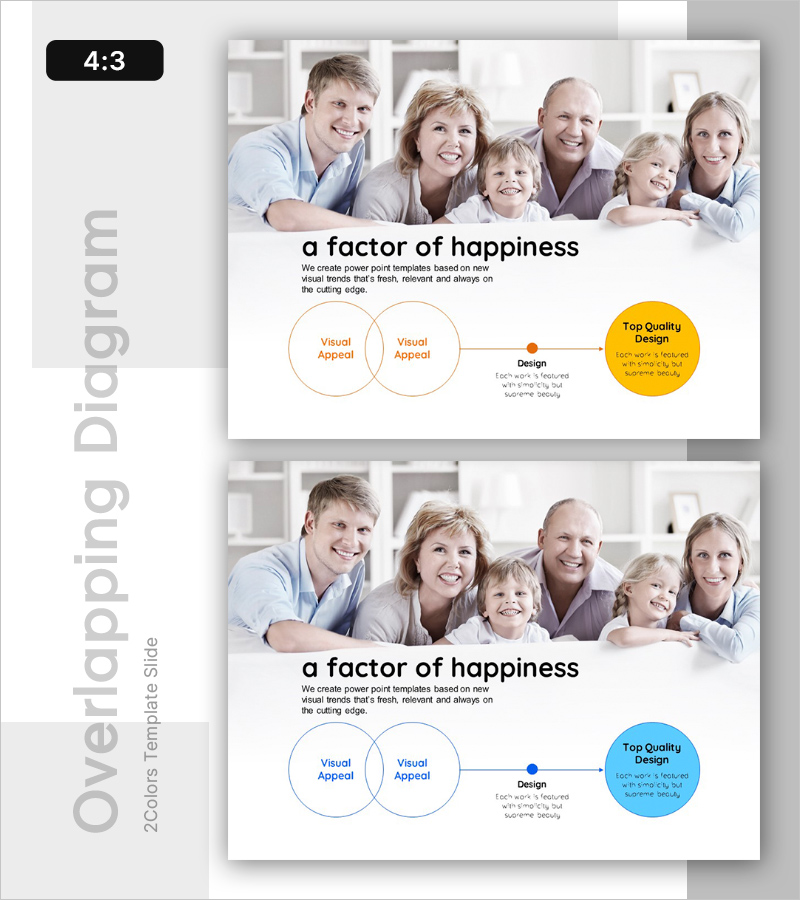
A 2-slide PowerPoint presentation set for visualizing business vision and strategic objectives. Featuring a beige and white background with orange circular diagrams and blue accent circles, this layout clearly expresses core business goals. The two-column structure with text area on the left and diagram on the right maximizes information delivery, making it ideal for company profiles, business plans, and strategic presentations. Available in 4:3 ratio PPTX format for immediate editing and customization.
Usage Points
-
Main Usage
A diagram slide that visually communicates organizational core objectives and vision. The two-circle structure clearly expresses goal components, enabling executives, investors, and employees to understand business direction effectively in presentations.
-
How to Use
Use in company profile vision/mission sections, business plan goal-setting pages, and strategic presentation key message slides. Input organizational goals and values in the text area, add key terms to diagram circles, and complete customized presentation materials.
-
Recommended For
Executives, business managers, marketing planners, and strategy teams presenting business objectives and vision. Suitable for investor briefings, employee training, partner collaboration proposals, and any presentation requiring goal alignment.
-
Slide Structure
Two-slide set with each slide divided into left text input area (title and description) and right circular diagram area. First slide features orange accent, second uses blue accent for visual variety. Each circle element is independently editable with flexible text size and color adjustment.


