Visual Diagram Slide for Hamburger Cooking Process
RJ0800046_15
- Last Update 08/13/2025
- File Size 0.5MB
- # of Slides 2
- File Format PPTX
- Slide Ratio 16:9
- Color
Keywords
About the Product
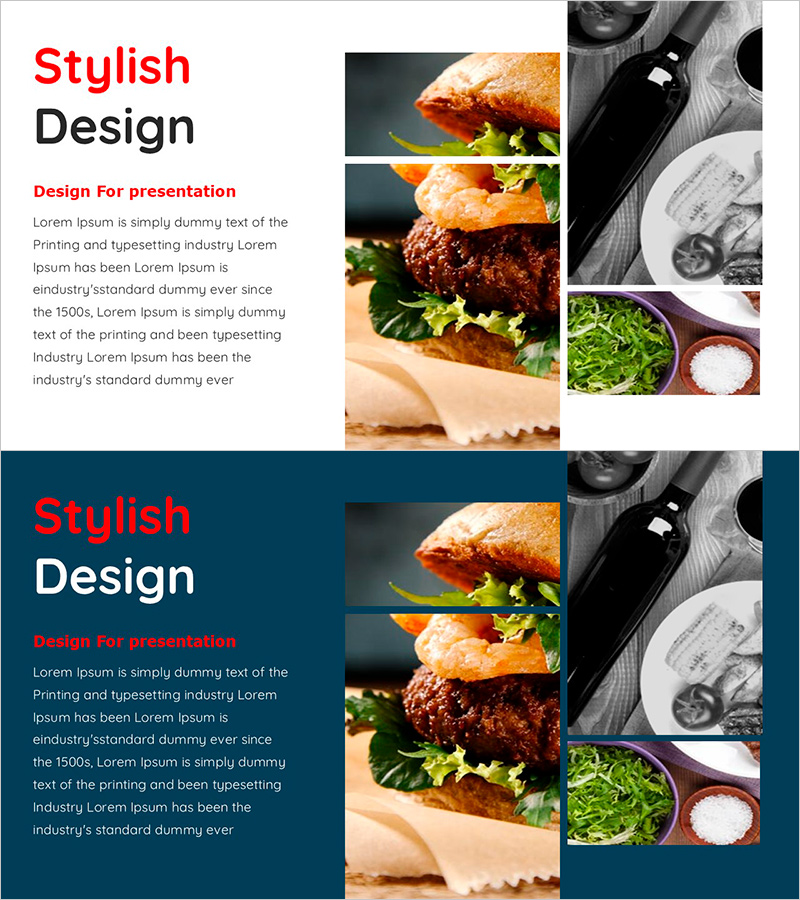
A PowerPoint slide featuring a 4-step closed-loop diagram that visualizes the hamburger cooking process. The design combines food photography in red, black, and orange tones with text in an overlapping layout, clearly conveying each stage of ingredient preparation and cooking. Formatted in 16:9 widescreen with 2 slides, this presentation template is ready to use for food-related presentations, culinary education, and food business introductions. Each node is independently editable, allowing you to adapt the diagram for various cooking processes or manufacturing stages.
Usage Points
-
Main Usage
Illustrate cooking processes, manufacturing stages, and workflow sequences using a closed-loop diagram format that helps audiences intuitively understand the connection between steps and the final product. Particularly effective for food, culinary, and food business presentations to explain the journey from ingredient preparation to finished dish.
-
How to Use
Open the slide and replace each node's image and text with your own cooking stages or manufacturing steps. Maintain the color scheme and layout while customizing text content, images, and arrow directions to fit your specific process explanation.
-
Recommended For
Restaurant and café brand presentations, culinary education and cooking technique seminars, food manufacturing process explanations, food business pitches, recipe development project reports, food service startup presentations, and any situation requiring clear visualization of cooking or production stages.
-
Slide Structure
2-slide template with 4-node closed-loop diagram structure on each slide. Food imagery, text, and directional arrows are arranged in a circular flow pattern. First slide features a light background; second slide uses dark blue background for contrast, allowing the same diagram to be applied across different presentation contexts.
Related Products
-

Column on Food Distribution1 - Visualizing Business Background and Necessity
#Business Introduction #Business Vision and Strategy #Diagram
-

Korean Traditional Cultural Customs – Diagram Slide for Understanding Business
#Business Introduction #Business Strategy #Diagram
-

4 Eco-Friendly Business Visions – Strategies for a Sustainable Future
#Company Introduction #Business Vision and Strategy #Diagram
-

Adventure Business Support Plan Diagram – Innovative Approach
#Product/Service Introduction #Business Management #Diagram
