Visualizing Information with Simple Boxed Graphs – Professionalism and Quality
RJ0800042_25
- Last Update 08/12/2025
- File Size 0.4MB
- # of Slides 2
- File Format PPTX
- Slide Ratio 16:9
- Color
Keywords
About the Product
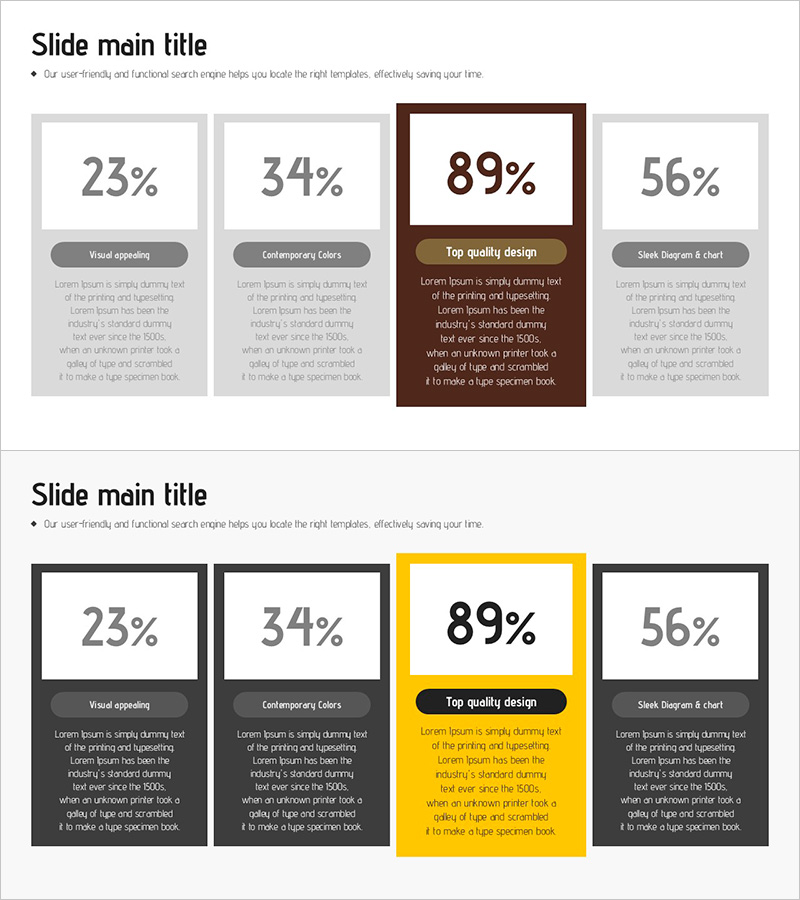
A PowerPoint slide featuring four boxed text containers arranged horizontally for clear information comparison. Each box contains a large percentage or number, a label, and descriptive text area, making it ideal for presenting key metrics, performance data, and comparative information. Two layout versions are provided with dark brown and yellow accent colors to highlight different sections. Perfect for business reports, marketing presentations, project results, and quality assessments. Fully editable in 16:9 widescreen PPTX format with customizable colors and text.
Usage Points
-
Main Usage
Display key performance indicators, marketing metrics, project results, and quality assessments across four distinct categories. The large numbers and labels enable quick comprehension of critical data, while descriptive text provides supporting context for each metric.
-
How to Use
Insert this slide into business reports, proposals, and strategic presentations to showcase quarterly results, campaign performance, customer satisfaction scores, or quality benchmarks. Simply replace the percentages, labels, and descriptions with your own data and adjust colors as needed.
-
Recommended For
Ideal for executives presenting performance reports, marketing managers sharing campaign results, project managers reporting completion metrics, quality assurance teams, sales leaders, and investors during pitch presentations. Recommended for roles requiring clear metric visualization and data-driven storytelling.
-
Slide Structure
Four independent boxed containers arranged in a single horizontal row. Each box contains three sections: large percentage or number at the top, category label in the middle, and descriptive text area at the bottom. Two color variants provided with dark brown and yellow accent options for visual differentiation.
Related Products
-

Schedule Template with Color Theme – Business Management and Action Plans
#Business Management #Diagram #Implementation Plan
-

Fantastic Wide PPT Sequence Diagram – Business Strategy Direction
#Business Strategy #Diagram #Business Direction
-

Market Analysis Slide Using Donut Charts and Table
#Market and Competitor Analysis #Diagram #Graph
-

Typographic Wide Template Flow Diagram – Innovative Business Strategy
#Business Strategy #Technical Approach #Diagram
