Ranking and Competition Charts for Analysis – Clear Data Visualization
RJ0800041_28
- Last Update 08/11/2025
- File Size 2.4MB
- # of Slides 2
- File Format PPTX
- Slide Ratio 16:9
- Color
Keywords
About the Product
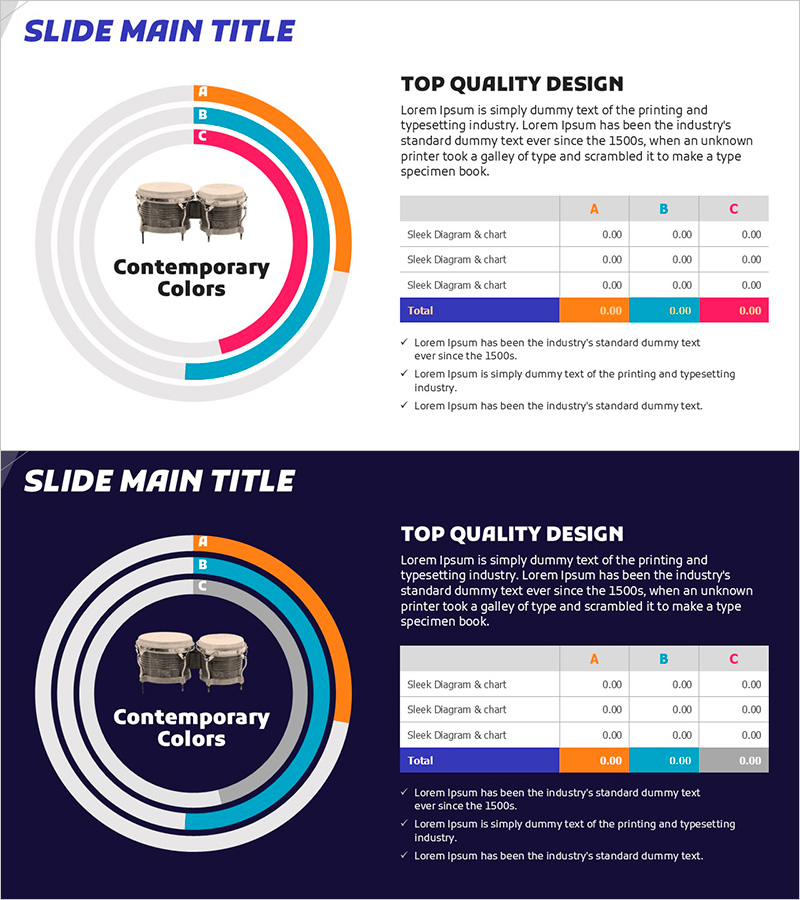
A three-color circular diagram PowerPoint slide designed for competitive analysis and ranking comparison. The concentric circle structure uses orange, blue, and pink to represent three comparison items (A, B, C) with a central image area. A data table on the right side allows you to input numerical values, while checkmark bullet points at the bottom emphasize key findings. This 16:9 widescreen slide set includes 2 fully editable slides ready for immediate use in presentations, reports, and business proposals.
Usage Points
-
Main Usage
Compare and analyze three competing items, market positions, or business units simultaneously. The concentric circular structure intuitively displays relationships and priorities among items, while the integrated data table reinforces quantitative comparison with numerical values.
-
How to Use
Replace the center image with product, service, or organizational icons. Update labels A, B, C with competitor names or comparison categories. Fill the right-side table with actual performance data and complete the bottom checkmark section with analysis insights or conclusions for your presentation.
-
Recommended For
Marketing managers, strategy planners, and business executives preparing competitive analysis reports, market overview presentations, and business proposals. Ideal for simultaneously comparing three competitors, three business divisions, or three performance metrics.
-
Slide Structure
The slide features a left-side concentric circular diagram in three colors (orange, blue, pink) with a central image placeholder, paired with a right-side data table containing three columns (A, B, C) and a Total row. Four checkmark bullet points at the bottom provide space for additional insights. Two slide variations are included: light background and dark background versions.
Related Products
-

Income Statement Table – Clearly Presenting Financial Plans and Performance
#Financial Plans and Performance #Diagram #Income Statement
-

Introduction of Key Players and Representatives
#Company Introduction #Diagram #Core Values, Vision, and Mission
-

Introduction of Key Business Personnel – Cluster Design
#Company Introduction #Diagram #Manpower
-

Business Income Statement Table – Visualizing Financial Performance
#Financial Plans and Performance #Diagram #Income Statement
