Visualizing Characteristics of Each Cat - Cluster Diagram
RJ0800040_7
- Last Update 08/11/2025
- File Size 0.3MB
- # of Slides 2
- File Format PPTX
- Slide Ratio 16:9
- Color
Keywords
- #Content-Based Slides
- #Design-Based Slides
- #Product/Service Introduction
- #Market and Competitor Analysis
- #Diagram
- #Text Box
- #Features
- #Customer Analysis
- #Cluster
- #Closed Cluster Diagram
- #Speech Bubble
- #16:9
- #cluster diagram PowerPoint
- #cat characteristics presentation
- #comparison analysis slide
- #icon diagram PPT
- #marketing presentation template
- #how to create cluster diagram in PowerPoint
About the Product
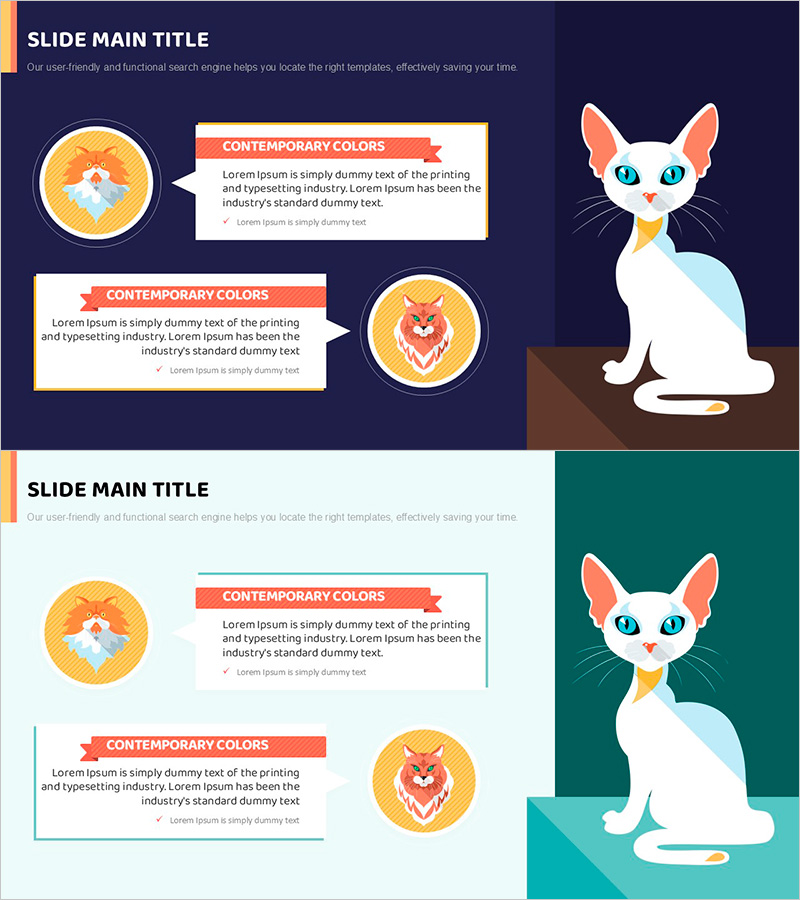
A cluster diagram PowerPoint slide for visually comparing and analyzing characteristics of different cats. This presentation template features circular nodes with icons and text connected by arrows, making it ideal for marketing customer analysis, product feature comparison, and organizational role definition. The navy background with orange and blue accent colors creates clear information hierarchy, while text boxes and checkmarks allow for detailed explanations. Designed in 16:9 widescreen PPTX format for immediate editing and customization.
Usage Points
-
Main Usage
Arranges multiple subjects (cats, customers, products, teams) in circular nodes connected by arrows to compare relationships and differences at a glance. Optimized for marketing customer segmentation, product positioning, and organizational role definition in comparative analysis sections.
-
How to Use
Enter subject names and characteristics in each circular node, add descriptions in text boxes, and use arrows to indicate relationships. Maintain the navy background with orange and blue accent colors for visual consistency, and use icons and checkmarks to highlight key points.
-
Recommended For
Recommended for marketing professionals conducting customer segmentation analysis, product planning teams comparing competitors, HR departments defining organizational roles, and consultants presenting strategic recommendations. Particularly effective for comparing 2-4 items in mid-scale analysis.
-
Slide Structure
2-slide set. First slide features navy background with 2 circular nodes (orange and blue borders) and 2 text boxes connected by arrows. Second slide uses light background with 2 circular nodes and 2 text boxes in alternative layout to accommodate various comparison scenarios.
Related Products
-

Participant Feedback Review Slide – Capturing Customer Voices
#Market and Competitor Analysis #Customer Success Stories #Diagram
-

Business Insight Through Two Perspectives
#Product/Service Introduction #Market and Competitor Analysis #Diagram
-

Body Fat Type Analysis Slide – Cluster Diagram
#Product/Service Introduction #Market and Competitor Analysis #Diagram
-

Fingerprints Left at the Crime Scene – Customer Analysis and Service Characteristics
#Product/Service Introduction #Market and Competitor Analysis #Diagram
