Judgment Diagram – Innovation for Business Execution
RJ0800035_9
- Last Update 08/10/2025
- File Size 0.2MB
- # of Slides 2
- File Format PPTX
- Slide Ratio 16:9
- Color
Keywords
About the Product
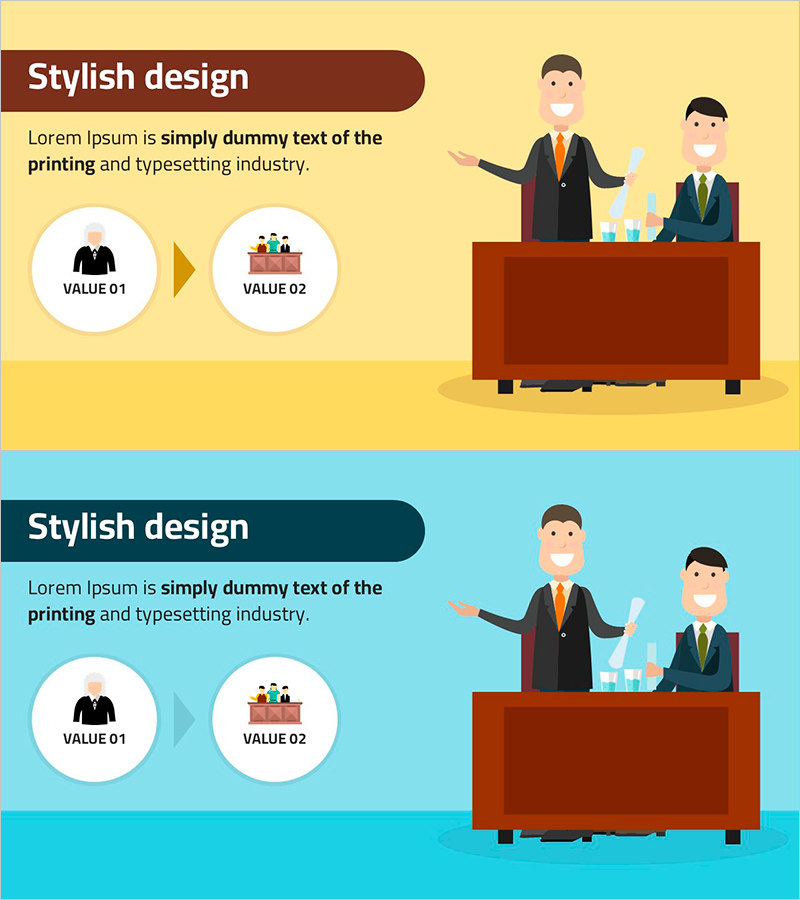
A 2-slide judgment diagram PowerPoint presentation template that visualizes technology innovation and business execution strategy. The design features a dual-tone yellow and blue background with two circular value icons connected by an arrow, creating a clear comparative layout for VALUE 01 and VALUE 02. The left side contains text description areas while the right side displays illustrated characters and chart elements, establishing a clear information hierarchy. Available in 16:9 widescreen PPTX format for immediate editing and use in technology department presentations, business management reports, and innovation strategy decks.
Usage Points
-
Main Usage
This slide visualizes technology innovation strategy and business execution approach using a two-step comparison structure. The dual-tone background and circular icon connection framework clearly express the relationship between two value propositions (VALUE 01 and VALUE 02), making it effective for presenting decision-making rationale and strategic planning.
-
How to Use
Place this slide in the innovation strategy section of technology department presentations or business management reports. Input descriptions for each VALUE in the left text area and add relevant images or charts to the right visual area to enhance information delivery. Customize the dual-tone background colors to match corporate brand guidelines for visual consistency.
-
Recommended For
Ideal for technology innovation managers, business strategy planning teams, R&D department leaders, and executive reporting specialists. Effectively used in new product launch presentations, technology roadmap explanations, and business model innovation proposals where strategic decision-making is required.
-
Slide Structure
Two-slide composition with each slide divided into left text area (title and description input space) and right visual area (illustrations, charts, icons). Two circular value icons in the center connected by arrows emphasize the comparative relationship, while the dual-tone background (yellow and blue) creates clear visual distinction.
Related Products
-

Actionable Insights for Business Strategy
#Business Management #Technical Approach #Text Box
-

Stylish Presentation Slide with Modern Design
#Business Management #Technical Approach #Diagram
-

Sustainable Future Action Plans – Innovation and Execution
#Business Management #Technical Approach #Diagram
-

Technology Comparison Analysis Connection Diagram
#Business Introduction #Technical Approach #Diagram
