Differentiated Features of New Cars – Captivating Visual Presentation
RJ0800034_13
- Last Update 08/09/2025
- File Size 1.7MB
- # of Slides 2
- File Format PPTX
- Slide Ratio 16:9
- Color
Keywords
- #Content-Based Slides
- #Design-Based Slides
- #Product/Service Introduction
- #Diagram
- #Composition
- #Differentiation Strategy for Products/Services
- #Cluster
- #Closed Cluster Diagram
- #16:9
- #circular diagram PowerPoint
- #closed diagram slide template
- #3-item comparison slide
- #product features presentation
- #car product introduction slide
About the Product
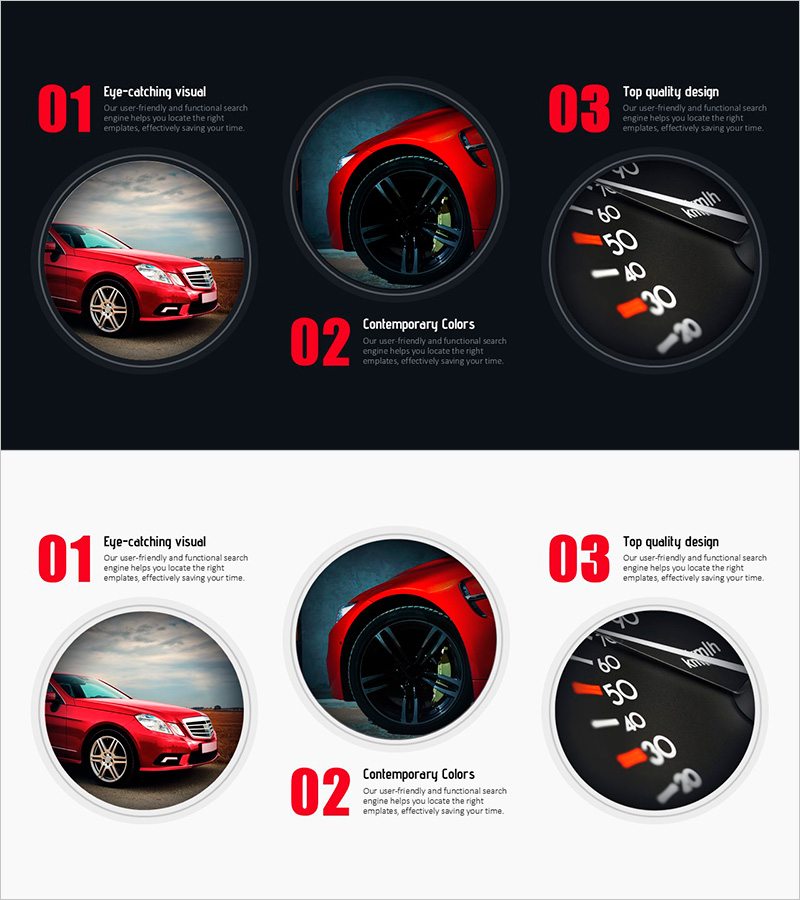
A PowerPoint slide featuring three circular closed diagrams to showcase differentiated features of new cars or products. The design uses dark and light backgrounds with red, black, and gray circular image frames, numbered 01, 02, 03 at the center for emphasis. Product photos, wheels, and dashboard images are cropped into circular shapes with border effects to maximize visual impact. Two layout options (dark and light backgrounds) are provided for flexible presentation scenarios. Ideal for automotive, electronics, and technology product introduction presentations.
Usage Points
-
Main Usage
Visualize three key features of new cars or products (design, performance, technology) using circular closed diagrams to clearly communicate differentiation points to audiences. Placing product photos in circular frames strengthens brand image and increases presentation impact.
-
How to Use
Insert product photos or feature images into each circular area and add feature descriptions in text boxes. Use dark background for premium presentation tone and light background for friendly, approachable presentations. Colors, text, and images are fully editable.
-
Recommended For
Automotive manufacturers and dealers launching new vehicles, electronics companies introducing new products, technology firms explaining solutions, marketing teams comparing products, and sales professionals preparing client proposals.
-
Slide Structure
2-slide layout. Slide 1 features dark background with 3 circular closed diagrams (numbered 01, 02, 03 with red accent color). Slide 2 uses light background with identical structure. Each circle is designed as an image insertion area with text boxes for title and description.
Related Products
-

Application Service Content and Differentiation Strategy – Infographic Design
#Product/Service Introduction #Diagram #Composition
-

Diagram Slide Visualizing Characteristics of Orange and Grapefruit
#Product/Service Introduction #Operational Plan #Diagram
-

Modern Wide PowerPoint Template Donut Chart - Visualizing Revenue Model
#Product/Service Introduction #Business Introduction #Diagram
-

Flow-based Slide for Natural Environment Fostering Strategy – Emphasizing Business Direction
#Product/Service Introduction #Business Strategy #Diagram
