Centralized Diagram Slide for Food Development Plan
RJ0800030_17
- Last Update 08/08/2025
- File Size 8.3MB
- # of Slides 2
- File Format PPTX
- Slide Ratio 16:9
- Color
Keywords
- #Content-Based Slides
- #Design-Based Slides
- #Product/Service Introduction
- #Business Vision and Strategy
- #Diagram
- #Benefits and Advantages
- #Core Competencies
- #Spread
- #Centralized Diagram
- #16:9
- #radial diagram PowerPoint
- #central image diagram slide
- #food development plan presentation
- #business strategy diagram
- #6-node diagram template
- #hub-and-spoke diagram PowerPoint
About the Product
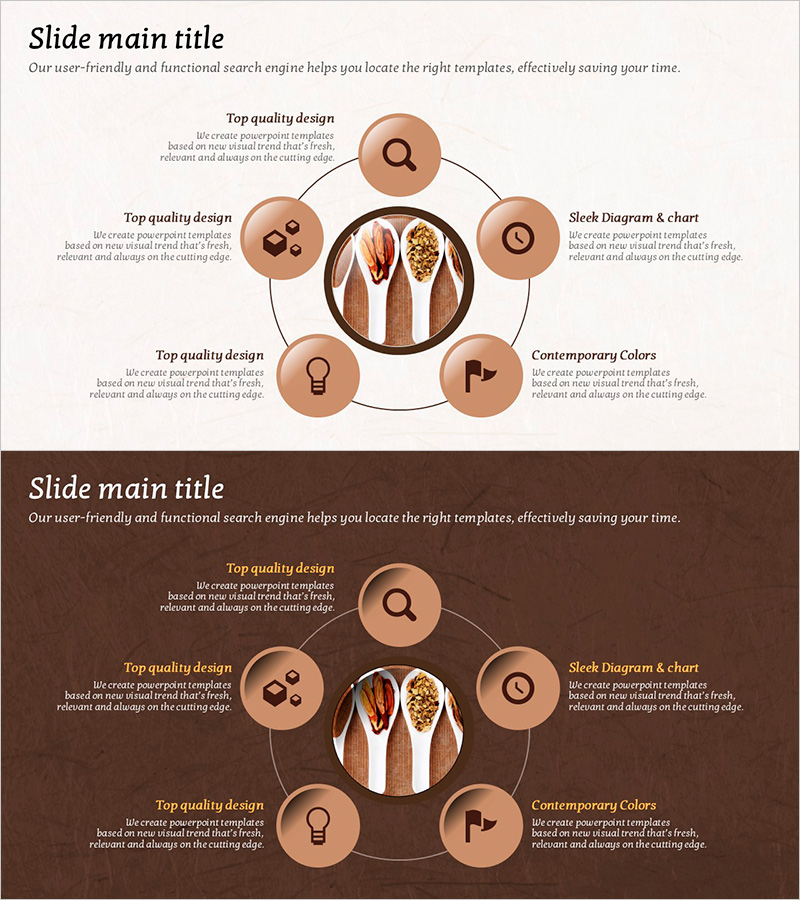
A radial diagram PowerPoint slide optimized for food development planning and business strategy presentations. The design features a central circular image surrounded by six nodes arranged in a radial pattern, each containing an icon and descriptive text. The warm beige and brown color palette conveys trust and professionalism in the food industry. Two slide variations are provided: one with a light background and one with a dark background, ensuring compatibility with different presentation environments. All nodes are independently editable, allowing you to customize text and icons to match your specific project requirements.
Usage Points
-
Main Usage
Visualize food industry development plans, strategic initiatives, and project components with a central focal image. The six radial nodes enable you to represent key implementation areas, responsible departments, timelines, budgets, risks, and performance metrics in a hierarchical structure.
-
How to Use
Place a product photo or core symbol in the central circular image area. Add titles and descriptions for each initiative in the surrounding six nodes. Customize the icons in each node to match your specific categories. Use the light background version for projector presentations and the dark background version for online meetings.
-
Recommended For
Ideal for food and beverage company product development managers, marketing planning teams, executive report writers, and consulting firms preparing strategy proposals. Perfect for business plans, investor pitch decks, strategic planning meetings, and cross-departmental collaboration presentations.
-
Slide Structure
Two-slide set: Slide 1 features a light beige background with a central circular image and six brown-toned circular nodes arranged radially. Slide 2 presents the same structure on a dark brown background. Each node includes an icon (search, analysis, goal, strategy, technology, results, etc.), title, and description text area, all independently editable.
Related Products
-

Connection and Diffusion Circular Diagram – Delivering Core Values of Products and Services
#Product/Service Introduction #Business Vision and Strategy #Diagram
-

Advantages of VR Learning Education – Revolutionizing Learning Experiences
#Product/Service Introduction #Business Vision and Strategy #Diagram
-

Automobile Management System Slide – Effective Business Strategy
#Product/Service Introduction #Business Vision and Strategy #Diagram
-

Illustrations and Diagrams of the Game – Sports Vision and Strategy
#Product/Service Introduction #Business Vision and Strategy #Diagram
