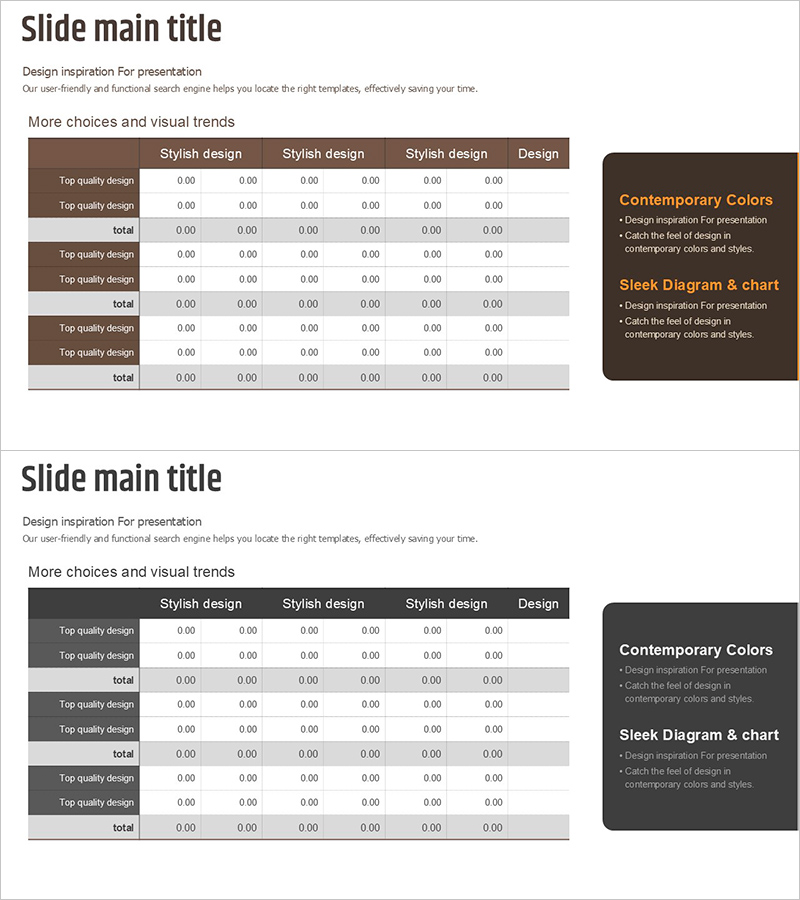
Brown Gray Table - Sleek Diagram Design
RJ0800020_6
- Last Update 08/05/2025
- File Size 0.2MB
- # of Slides 2
- File Format PPTX
- Slide Ratio 16:9
- Color
Keywords
About the Product
A table diagram PowerPoint slide that uses brown and gray tones to clearly express information hierarchy and data relationships. The 6-column by 3-row comparison table structure enables simultaneous presentation of qualitative and quantitative information, with a dark brown header row and alternating light gray data rows for optimal readability. The 2-slide set is optimized for 16:9 widescreen format and features clearly defined text input areas for immediate editing. Ideal for business reports, proposals, competitive analysis, budget breakdowns, and analytical presentations where structured data comparison is essential.
Usage Points
-
Main Usage
A data organization slide designed to compare and analyze multiple items in a row-column structure. Use for product specification comparisons, competitive analysis, performance metrics, budget allocations, and other scenarios requiring clear tabular data presentation.
-
How to Use
Enter column headers and row labels, then populate each cell with numerical values or text. The brown header and gray alternating background automatically emphasize information hierarchy, enabling professional presentation without additional formatting. Rows and columns can be added or colors adjusted as needed.
-
Recommended For
Finance, marketing, and operations professionals presenting performance analysis, budget planning, and market research findings. Suitable for consulting proposals, business reports, strategic planning presentations, and educational materials where structured data comparison enhances understanding and decision-making.
-
Slide Structure
2-slide set with each slide containing a 6-column (item label + 5 comparison items) by 3-row (header + 2 data rows) table. Header features dark brown background with white text; data rows alternate between light gray and white backgrounds for visual distinction and improved readability.
Related Products
-

Funding Plan Table – Visualizing Financial Performance
#Financial Plans and Performance #Diagram #Capital Requirements
-

Risk Management Presentation Template – Data Analysis and Strategic Approach
#Operational Plan #Diagram #Risk Management
-

Target-specific Analysis Diagram – Customer Insights and Value Delivery
#Product/Service Introduction #Market and Competitor Analysis #Diagram
-

Key Takeaways for Game Strategy – Clear Insights Presented
#Marketing Plan and Strategy #Diagram #Marketing Strategy
