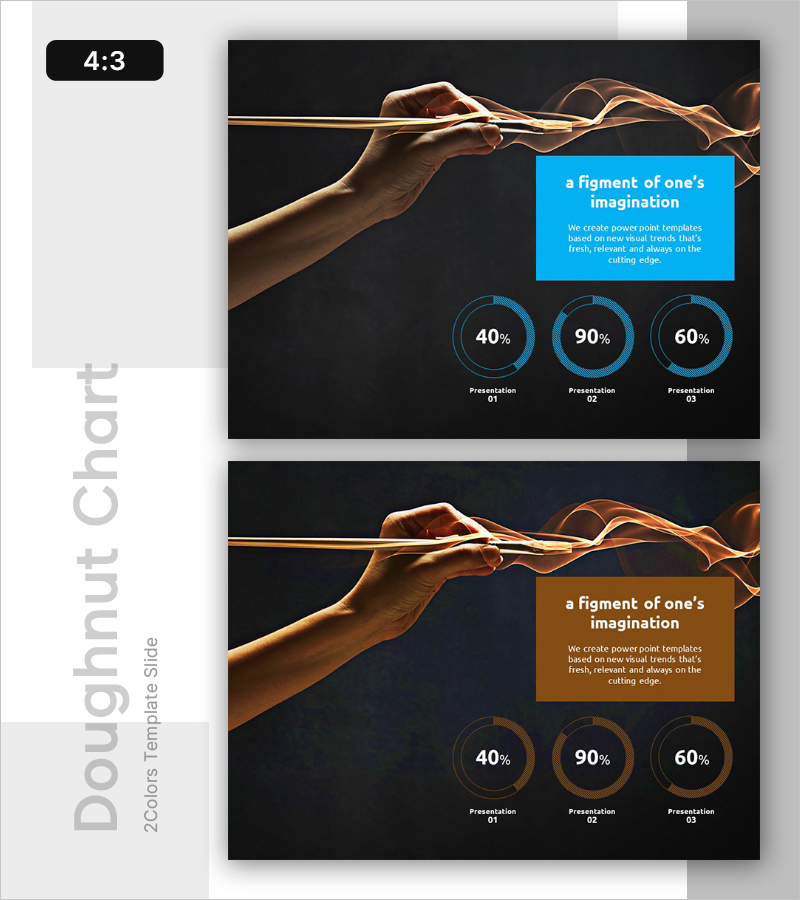
Market Share Donut Graph - Enhance Market Analysis and Competitiveness
RL0100074_4
- Last Update 01/22/2025
- File Size 3.6MB
- # of Slides 2
- File Format PPTX
- Slide Ratio 4:3
- Color
Keywords
About the Product
A donut chart PowerPoint slide designed for market analysis and competitive assessment. This 2-slide presentation features three circular charts set against a dark background with blue accent colors, enabling side-by-side comparison of different market share data. A text box at the top accommodates key messages, while label areas below each chart allow you to mark presentation stages or categories. Provided in 4:3 ratio PPTX format, this slide deck is ready for investor pitches, executive briefings, marketing strategy meetings, and other business presentations requiring data-driven visuals.
Usage Points
-
Main Usage
Visualizes three-part ratio data such as market share percentages, sales distribution, or customer segments. Donut charts intuitively show part-to-whole relationships, making them ideal for competitor benchmarking, market positioning analysis, and business performance evaluation.
-
How to Use
Enter your analysis title or key message in the blue text box at the top, then update the three donut charts with your actual data. Add category names or presentation stage labels in the areas below each chart to enhance clarity. Maintain the dark background and blue accent colors to ensure brand consistency throughout your presentation.
-
Recommended For
Finance teams, marketing departments, executives, and investor relations professionals presenting market analysis findings. Particularly effective for quarterly performance reports, new business proposals, investor pitches, and competitive landscape discussions requiring data-backed decision-making.
-
Slide Structure
Two-slide layout with the first slide featuring a blue text box and three donut charts, and the second slide showing a brown text box with identical chart placement. Each slide is organized in three information layers: top image area, center text box, and bottom three-chart section for balanced visual hierarchy.


