Grey Blue Table Set in Diagram Style
RJ0800016_19
- Last Update 08/04/2025
- File Size 0.3MB
- # of Slides 2
- File Format PPTX
- Slide Ratio 16:9
- Color
Keywords
About the Product
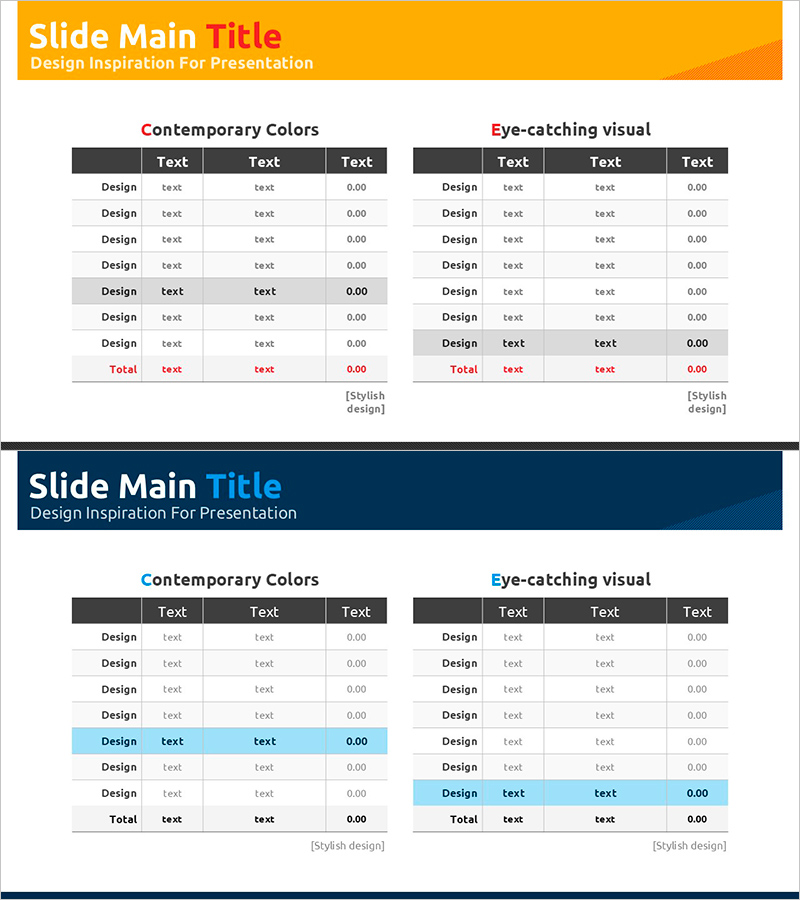
A grey-blue table diagram PowerPoint slide set featuring 2 slides with 6-row data comparison layouts. Each slide presents two design variations: 'Contemporary Colors' on the left and 'Eye-catching Visual' on the right, enabling flexible presentation approaches. Dark grey headers alternate with light grey row backgrounds to enhance information readability, while the rightmost numeric column (0.00) is optimized for financial and performance data entry. Delivered in 16:9 widescreen PPTX format for immediate editing. Ideal for company performance analysis, product feature comparison, market data organization, and business presentations requiring structured data visualization.
Usage Points
-
Main Usage
Optimized for comparing and organizing multiple items, metrics, and attributes in matrix format. Transforms quantitative information—company KPIs, product features, market data, departmental metrics—into clear visual structures that enhance audience comprehension and decision-making.
-
How to Use
Enter item names in the 'Design' cells of each row, then populate corresponding data or descriptions in the text columns. Use the 'Total' row for summary or aggregate information. Apply the Contemporary Colors version for information-focused presentations and the Eye-catching Visual version for sections requiring emphasis and audience attention.
-
Recommended For
Finance and accounting teams presenting budget reviews, marketing teams analyzing campaign performance, sales teams comparing client proposals, executive KPI reviews, consulting reports with benchmarking sections, and operational status updates across departments.
-
Slide Structure
2-slide set. Each slide contains 2 tables (Contemporary Colors and Eye-catching Visual) arranged side-by-side. Each table structure: 1 dark grey header row + 6 light grey data rows + 1 total row (8 rows total). Each row includes 'Design' label + 3 text input cells + numeric column (0.00).
Related Products
-

Interior Essential Furniture – The Essence of Design
#Product/Service Introduction #Diagram #Features
-

Core Goals of Senior Support Programs – Cluster Diagram
#Product/Service Introduction #Operational Plan #Diagram
-

Cluster Diagram Slide Visualizing Relationships Between Connected Items
#Technical Approach #Diagram #Service Implementation Plan
-

Premium Idea Strategy Slide - Business Progress for Awards
#Business Strategy #Diagram #Business Direction
