Street Food Strategy Visualization Diagram Slide
RJ0800013_14
- Last Update 08/03/2025
- File Size 2.5MB
- # of Slides 2
- File Format PPTX
- Slide Ratio 16:9
- Color
Keywords
About the Product
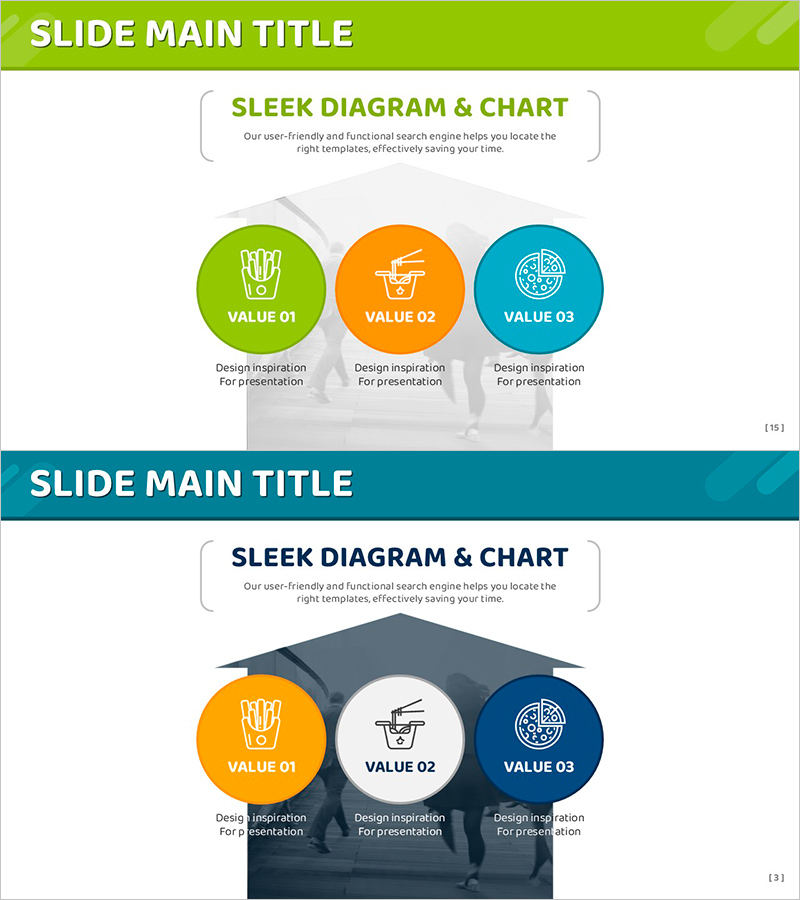
A radial diagram PowerPoint slide featuring three circular nodes to highlight core values and strategic elements. The design uses contrasting lime green, orange, and teal colors with distinct icons for each node to enhance visual differentiation. This 2-slide set includes two layout variations: one with nodes positioned at the top and another with nodes at the bottom, both optimized for 16:9 widescreen format. Instantly editable and ready to use in business presentations, product introductions, strategy briefings, and organizational value communications.
Usage Points
-
Main Usage
Designed to visually emphasize and explain three key elements such as core values, strategic pillars, or product features. The radial structure connects each circular node to a central concept while maintaining independence, allowing simultaneous representation of hierarchical relationships and parallel structures.
-
How to Use
Enter text and icons into the three circular nodes positioned at the top or bottom of the slide. All node colors and icons are fully customizable. Add background images or supplementary text boxes to provide contextual information and enhance the narrative flow.
-
Recommended For
Ideal for marketing strategy presentations, product launch events, organizational vision and mission statements, business strategy meetings, consulting reports, educational seminars, and corporate training materials. Particularly effective when presenting three equally important concepts or strategic pillars.
-
Slide Structure
Two-slide set with identical 3-node radial design in different positions. Slide 1 features lime, orange, and teal circular nodes at the top with description text areas below each node. Slide 2 mirrors the design with nodes positioned at the bottom. Each node includes icon placement and text label fields, optimized for 16:9 widescreen presentation format.
Related Products
-

Highlighting Skincare Functions Slide – Product Introduction
#Product/Service Introduction #Business Introduction #Diagram
-

Triple Team Introduction Slide – Overview of Our Team
#Company Introduction #Diagram #Organizational Chart
-

Cosmetic Production Strategy Slide Template – Premium Quality Design
#Product/Service Introduction #Operational Plan #Diagram
-

PowerPoint Template for Service Operation Strategy Presentation
#Business Management #Operational Plan #Technical Approach
