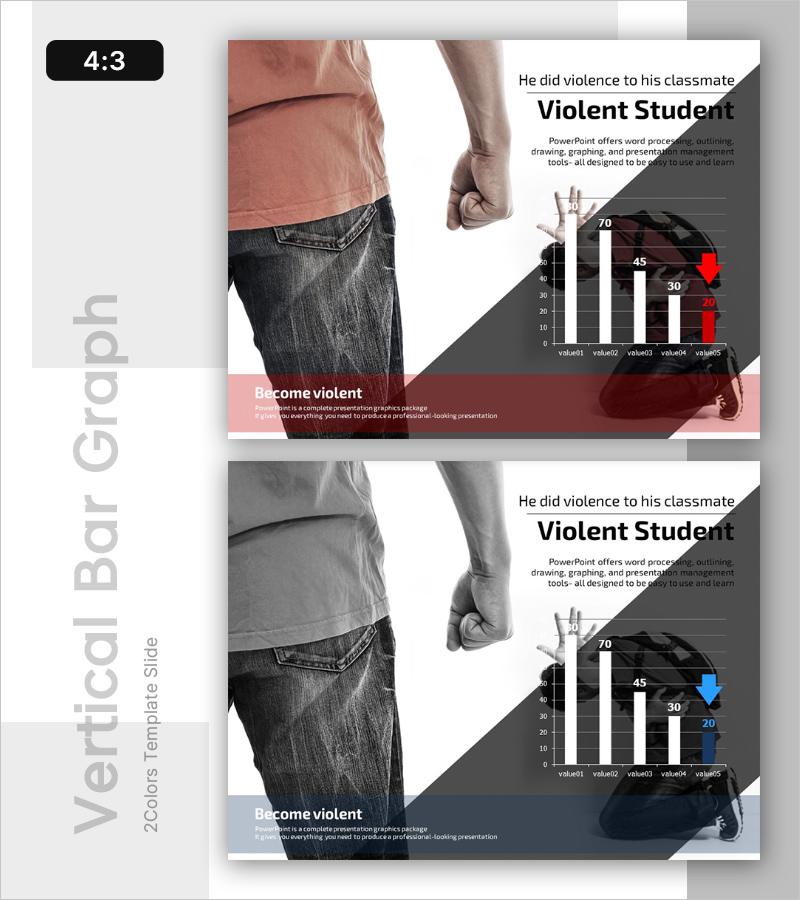
School Violence Survey Graph – Present and Future
RL0100072_3
- Last Update 01/22/2025
- File Size 1MB
- # of Slides 2
- File Format PPTX
- Slide Ratio 4:3
- Color
Keywords
About the Product
A PowerPoint slide for analyzing school violence data with visual impact and clarity. The two-slide set features horizontal and vertical bar charts with red and blue accent colors against contrasting white and dark backgrounds, making numerical comparisons immediately apparent. The balanced layout between text and chart areas provides professional data visualization for policy reports, safety education presentations, and research findings. Ideal for educational institutions, government agencies, and research organizations presenting violence prevention initiatives and statistical analysis.
Usage Points
-
Main Usage
Present school violence survey findings through quantitative bar chart analysis. The dual chart format (horizontal and vertical) enables simultaneous display of trend changes over time and comparative analysis across categories, delivering objective data to policymakers, educators, and stakeholders.
-
How to Use
Deploy in education ministry reports, school safety seminars, and social issue analysis presentations within the situation assessment section. Replace chart data with actual survey statistics and customize text areas with investigation background and objectives for immediate presentation use.
-
Recommended For
Education administrators, school safety departments, social welfare researchers, policy institutions, parent education coordinators, and violence prevention program managers presenting current situation analysis and policy development initiatives.
-
Slide Structure
Two-slide configuration: first slide combines title and descriptive text area with horizontal bar chart (5 items with numerical values); second slide features vertical bar chart (5 items with red and blue accent colors) in symmetric layout with text area for analysis notes.
Related Products
-

Wishing you success after setbacks Slide
#Emotional Messages
-

Comparative Analysis of Our Own Competitiveness – Effective Market Analysis Slide
#Emotional Messages
-

War Aims – Intro Slide Maximizing Strategic Efficiency
#Emotional Messages
-

Strong Business Competitive Strategy Slide Template
#Emotional Messages
