Agricultural Growth Graph by Year – Market Outlook
RL0100070_3
- Last Update 01/22/2025
- File Size 2MB
- # of Slides 2
- File Format PPTX
- Slide Ratio 4:3
- Color
Keywords
About the Product
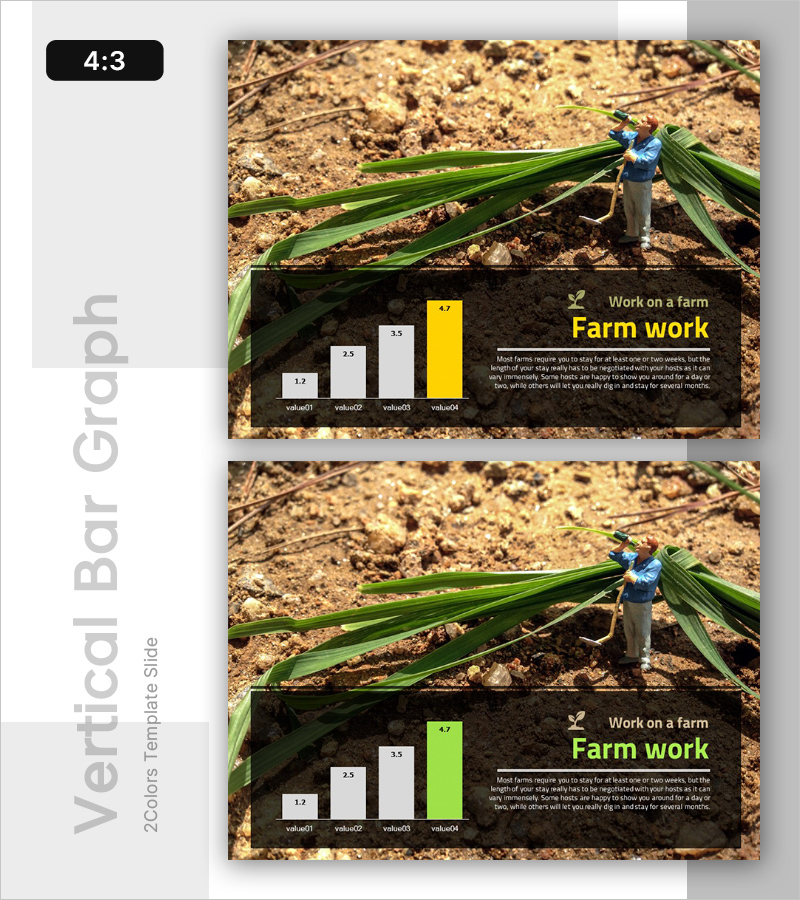
A PowerPoint slide that visualizes agricultural market outlook and year-over-year growth trends using a four-step vertical bar chart. The final data point is highlighted in yellow to emphasize the latest figures or target values. Set against a dark background with bright text and chart elements, this slide delivers excellent readability during presentations. Ideal for business plans, market analysis reports, and investor pitch decks in the agriculture sector. The slide is fully editable in 4:3 PPTX format, allowing you to input your own data and customize labels instantly.
Usage Points
-
Main Usage
This slide effectively displays year-over-year agricultural market data, sales growth, production volume changes, and other time-series metrics in a comparative format. The yellow highlight draws attention to the latest performance or target figures, making it ideal for agriculture companies, government agencies, and investment firms presenting market credibility and growth potential.
-
How to Use
Input your actual data values into the four bar chart items and rename the legend labels (value01–value04) to match your data categories. Set the yellow bar to represent the most recent year or target value to maximize visual emphasis. The dark background ensures data clarity on large presentation screens.
-
Recommended For
Agricultural company executives, farm product distributors, agricultural policy officials, agritech investors, and food manufacturing marketing teams presenting market conditions, business performance reports, and investment pitches. Also suitable for academic presentations and industry analysis reports in the agriculture sector.
-
Slide Structure
The slide features a title area (Work on a farm / Farm work) and descriptive text space at the top, with a four-item vertical bar chart positioned at the bottom. Each bar includes numeric labels, and the final bar (value04) is highlighted in yellow. Two slide variations are provided with different accent colors (yellow and green options) for flexible design choices.
Related Products
-

Introducing a New Innovative Business – Vision and Differentiation Strategy
#Emotional Messages
-

Business Outlook Template Ending Cover – Modern Sensibility
#Emotional Messages
-

Research Status Analysis Graph – Insights on Market and Competitors
#Emotional Messages
-

Future-oriented Template Cover – Bright Vision Ahead
#Emotional Messages
