Research Status Analysis Graph – Insights on Market and Competitors
RL0100027_3
- Last Update 01/19/2025
- File Size 4.2MB
- # of Slides 2
- File Format PPTX
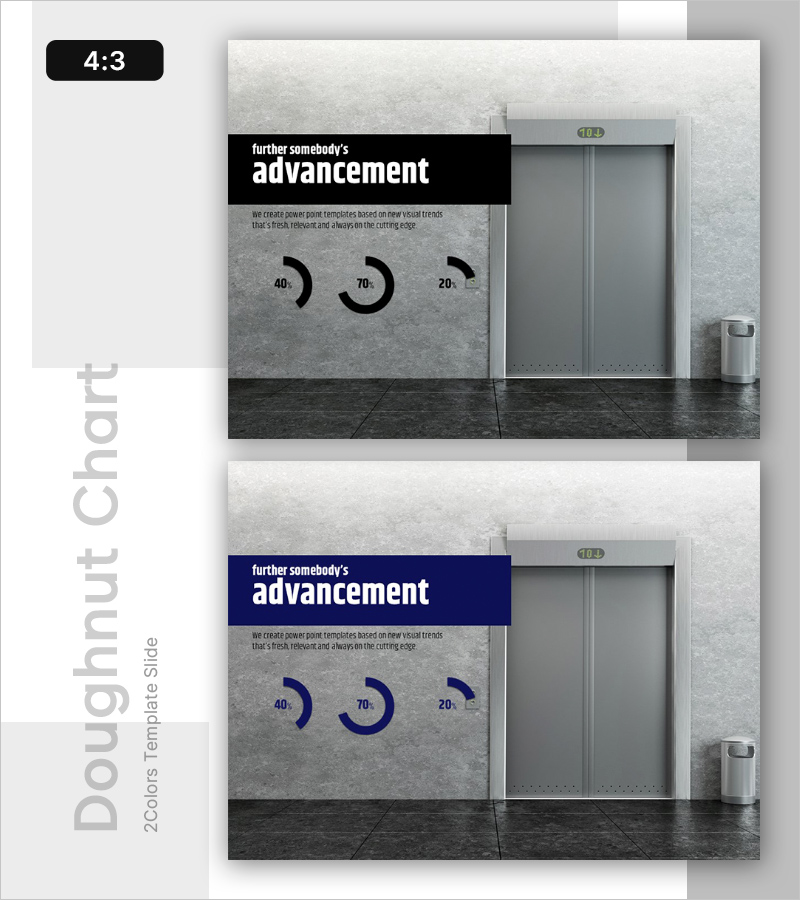
- Slide Ratio 4:3
- Color
Keywords
About the Product
A donut chart slide that visualizes market status and competitor trends at a glance. Display three ratio data points—40%, 70%, 20%—to illustrate market share, development progress, production stages, and competitive analysis. The minimalist layout features a concrete background with two color options: black and blue, allowing you to match your corporate brand. This PowerPoint slide is immediately editable; simply modify text and figures to adapt it to various presentation scenarios, business plans, investor pitches, and market analysis reports.
Usage Points
-
Main Usage
Communicate market status, competitor share, development progress, and production metrics through ratio-based analysis. Donut charts clearly express the proportion of parts relative to the whole, strengthening decision-making evidence and stakeholder confidence.
-
How to Use
Replace the 40%, 70%, 20% figures with your actual data and enter analysis titles and descriptions in the text area above. Select the black or blue background version matching your brand identity, then insert into business plans, investor presentations, or market analysis reports.
-
Recommended For
Marketing managers, business strategists, investor relations professionals, and market research analysts. Ideal for teams conducting new market entry assessments, competitive strategy development, and data-driven opportunity analysis.
-
Slide Structure
Header area (black or blue) with title and two-line description text; center section with three donut charts and corresponding percentage values; elevator image on the right. Contains three text input areas and three chart data modification zones for flexible customization.
Related Products
-

Innovative Idea Template Ending Cover
#Emotional Messages
-

Introducing a New Innovative Business – Vision and Differentiation Strategy
#Emotional Messages
-

Business Idea Analysis Graph – Innovation and Vision
#Emotional Messages
-

Business Outlook Template Ending Cover – Modern Sensibility
#Emotional Messages
