Data Visualization Diagram for Cosmetic Ingredient List
RJ0800008_12
- Last Update 08/01/2025
- File Size 0.6MB
- # of Slides 2
- File Format PPTX
- Slide Ratio 16:9
- Color
Keywords
About the Product
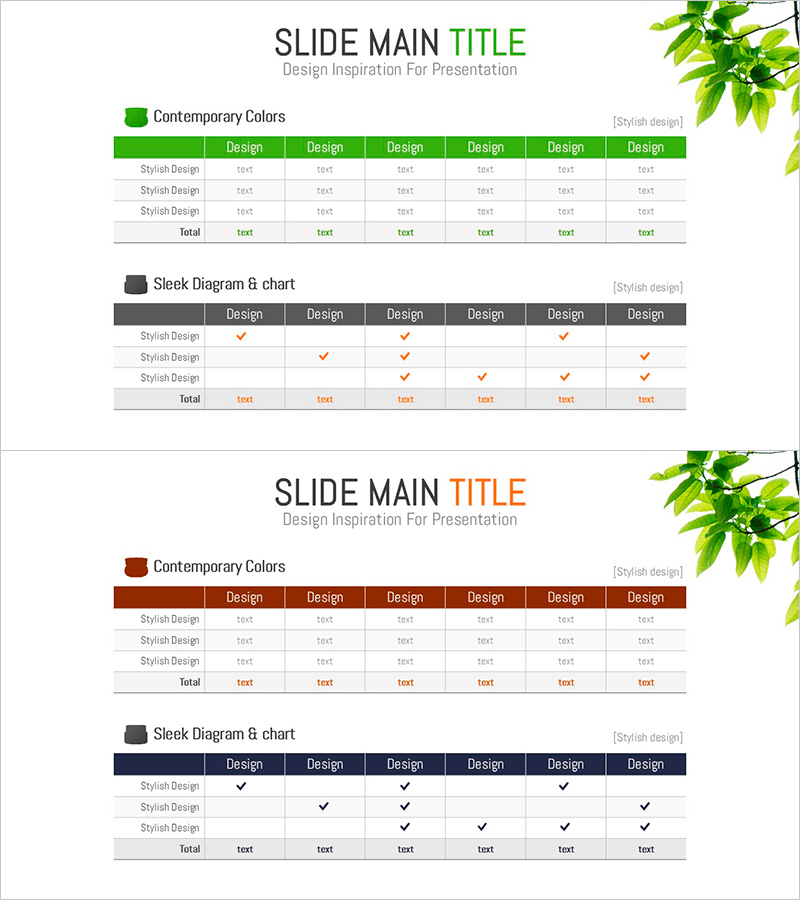
A professional 7-column data table PowerPoint slide designed for organizing cosmetic ingredient lists and product information systematically. Available with green and orange header options, each column accommodates product names, ingredients, concentrations, benefits, usage instructions, and more. Includes a comparison section with checkmarks to highlight product differences at a glance. The 2-slide set presents multiple data visualization approaches and is optimized for modern 16:9 widescreen presentations.
Usage Points
-
Main Usage
Organize and present cosmetic product ingredients, concentrations, and benefits in a structured table format while enabling systematic comparison across products. Ideal for marketing materials, product launch presentations, ingredient analysis reports, and brand positioning documents that require data credibility.
-
How to Use
Enter product names, ingredients, concentrations, benefits, usage instructions, pricing, and ratings in the header row and corresponding data cells. Use the checkmark comparison section to mark product characteristics (hypoallergenic, moisturizing, UV protection, etc.) for quick visual comparison. All colors and text are fully customizable.
-
Recommended For
Beauty and cosmetics brand marketing teams, product development managers, dermatologists and beauty professionals, e-commerce operators, beauty bloggers and influencers, and ingredient analysis report writers seeking to communicate product information and conduct comparative analysis.
-
Slide Structure
Slide 1: Green-header 7-column table (product name, ingredients, concentration, benefits, usage, price, rating) with 3 data rows. Slide 2: Orange-header table with checkmark comparison section (3 products × 6 characteristics). All cells are text-editable with color customization support.
Related Products
-

Agricultural and Marine Products Icon Text Table
#Product/Service Introduction #Diagram #Features
-

Analysis Table of Our Mobile App Configuration – Simple Data Visualization
#Product/Service Introduction #Diagram #Other
-

Game Data Analysis Table – Market Analysis and Trends
#Product/Service Introduction #Market and Competitor Analysis #Diagram
-

High Calorie Food Ingredient Table – Visually Representing Foods
#Product/Service Introduction #Diagram #Features
