Business Growth Analysis Graph – Market Outlook and Growth Potential
RL0100040_4
- Last Update 01/20/2025
- File Size 1.8MB
- # of Slides 2
- File Format PPTX
- Slide Ratio 4:3
- Color
Keywords
About the Product
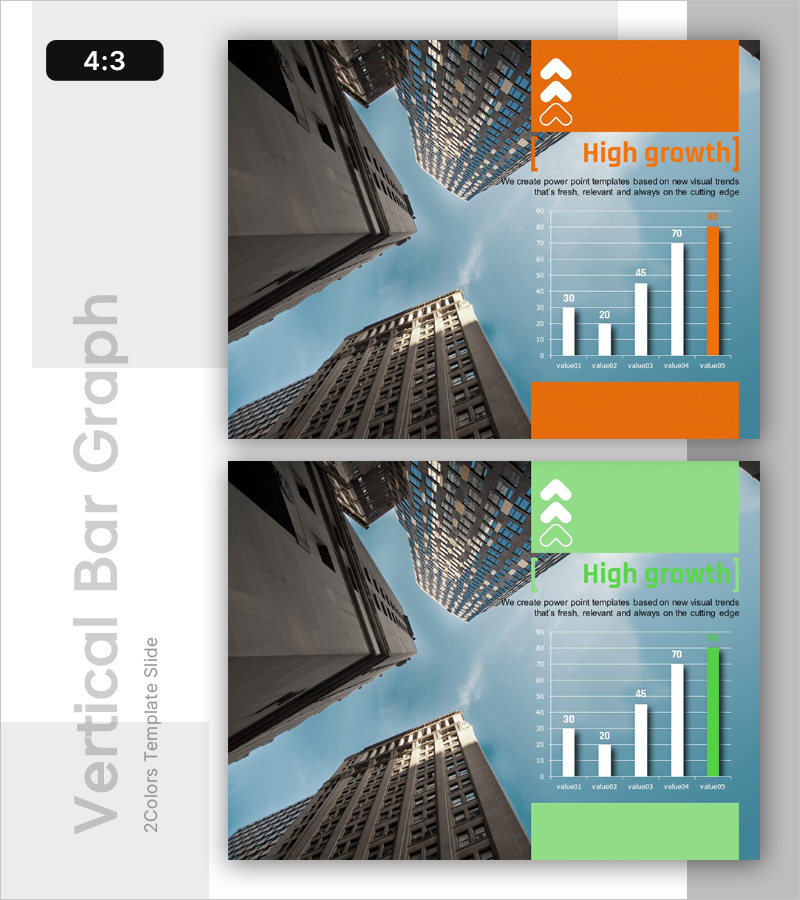
A vertical bar chart PowerPoint slide that visualizes business growth trends and market outlook at a glance. The slide features contrasting orange and green colors representing five data segments, with a cityscape image on the left side emphasizing the momentum of business expansion. Composed of 2 slides in 4:3 aspect ratio, each slide includes title and descriptive text areas along with data input spaces. Instantly applicable for investor presentations, business reports, and marketing plans where growth metrics need to be highlighted.
Usage Points
-
Main Usage
This slide visualizes numerical data such as business growth rates, market share changes, and quarterly or annual performance trends through bar chart comparison. It plays a key role in investor presentations emphasizing growth potential and executive reports conveying business performance visually.
-
How to Use
Enter analysis title and description in the text areas, then replace the bar graph values (30, 20, 45, 70, 80) with actual data. Differentiate the orange bars as targets and green bars as actual results to strengthen comparative analysis. The cityscape image can be replaced to match your industry or corporate image.
-
Recommended For
Recommended for investor presentations, IR materials, executive reports, business plans, and marketing proposals requiring business growth analysis. Particularly suitable for professionals (executives, finance managers, business development teams, marketing teams) who need to emphasize numerical growth metrics such as quarterly/annual performance comparisons and market share changes.
-
Slide Structure
Composed of 2 slides, each divided into three sections: top title area (orange or green background), left cityscape image (approximately 40% width), and right graph area (approximately 60% width). The graph consists of 5 data segments (value01–value05) with 2 vertical bar sets, and a descriptive text area positioned in the center.
Related Products
-

Know-how Template Intro – Essential for Presentations
#Emotional Messages
-

Potential Template Cover – A Professional and Emotional Start
#Emotional Messages
-

Business Vision Template Focused on Achievements – The Fruit of One's Efforts
#Emotional Messages
-

Cluster Slide for Company Overview - See the Possibilities
#Emotional Messages
