Come up with an Innovative Idea – Bar Graph for Market Analysis
RL0100067_4
- Last Update 01/22/2025
- File Size 1.8MB
- # of Slides 2
- File Format PPTX
- Slide Ratio 4:3
- Color
Keywords
About the Product
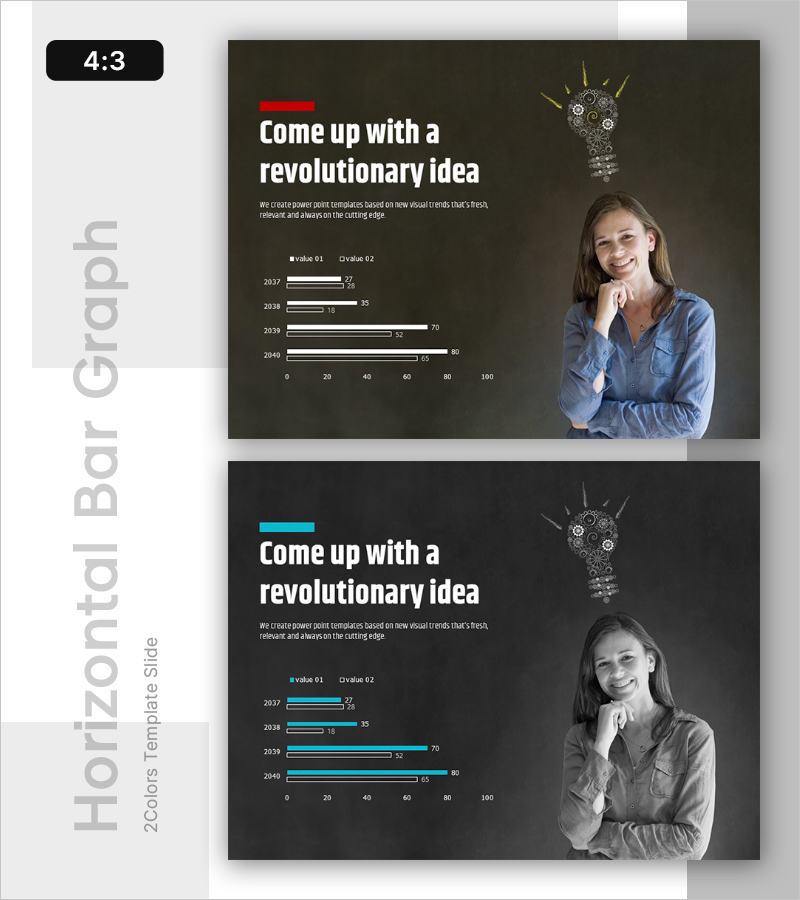
A 2-slide PowerPoint presentation designed to showcase innovative ideas through data visualization. The slides feature a dark background with white typography and red accent lines, displaying horizontal bar charts that compare two data categories across multiple years. A professional portrait photo on the left side builds credibility, while a gear icon illustration in the upper right symbolizes innovation and creativity. This presentation slide is ready to use for market analysis, competitive benchmarking, performance comparison, and strategic planning presentations.
Usage Points
-
Main Usage
Compare year-over-year or category-based data across two metrics to reveal market trends, performance trajectories, and competitive positioning at a glance. Serves as a critical decision-support slide in innovation strategy, business performance, and market analysis sections.
-
How to Use
Replace the horizontal bar values and legend with your own data. Substitute the left-side portrait photo with your company executive or team member image, then edit the title and descriptive text to match your presentation context and messaging.
-
Recommended For
Ideal for business performance reports, market analysis presentations, competitive benchmarking, investor pitch decks, and strategic planning meetings. Recommended for executives, marketing professionals, strategy planners, and sales leaders who need to support data-driven decision-making.
-
Slide Structure
Two-slide layout with each slide containing a title area with red line accent at the top, a horizontal bar chart in the center showing two data series across four years, a professional portrait photo area on the left, and a gear icon illustration in the upper right. Formatted in 4:3 aspect ratio for seamless compatibility with existing presentations.
Related Products
-

Presentation Slide for Valuable Consumer Goods Introduction and Diagram
#Emotional Messages
-

Presentation Slide for Idea Development
#Emotional Messages
-

Automotive Product Introduction – Personalization and Innovation
#Emotional Messages
-

Intro Slide for Asking Ideas – Capturing Innovation and Creativity
#Emotional Messages
