Yellow Check Schedule – Diagram Highlighting Visual Appeal
RJ0800003_25
- Last Update 07/31/2025
- File Size 0.5MB
- # of Slides 2
- File Format PPTX
- Slide Ratio 16:9
- Color
Keywords
About the Product
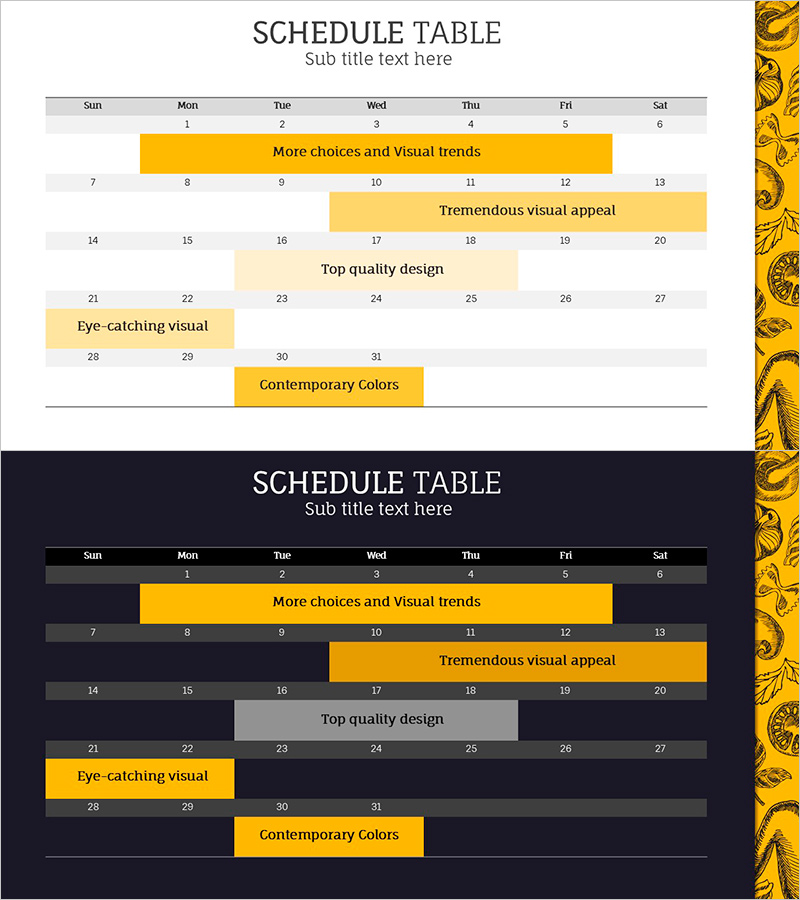
A horizontal table diagram PowerPoint slide for visualizing weekly schedules and project timelines. The design features a 7-day calendar layout with light gray rows and bright yellow accent bars to highlight key activities. This 2-slide set includes both a light background version for printing and a dark background version for projector presentations. Each cell is fully editable, allowing you to add specific dates, tasks, and milestones. Perfect for presentations, project reports, marketing campaign schedules, and educational seminars where clear timeline visualization is essential.
Usage Points
-
Main Usage
Visualize weekly schedules, project timelines, marketing campaign calendars, and educational seminar schedules with a clear 7-day structure. The yellow accent bars highlight important periods and key activities, making it easy for audiences to understand project phases and deadlines at a glance.
-
How to Use
Enter schedule items in each cell and adjust the yellow highlight bar position and length to mark specific time periods. Use the light background version for printed materials and the dark version for projector presentations. Customize colors and text to match your brand guidelines and presentation theme.
-
Recommended For
Project managers, marketing professionals, educators, event planners, and executives presenting schedules and timelines. Ideal for weekly team meetings, quarterly planning presentations, project kickoff meetings, marketing strategy sessions, and educational program schedules.
-
Slide Structure
7-column horizontal table layout representing days of the week (Sunday through Saturday) with multiple rows for schedule entries. Yellow accent bars span across specific date ranges to indicate project phases or key activity periods. Includes 2 color variations: light background for print-friendly use and dark background for screen presentations.
Related Products
-

Real Estate Sales Table – Financial Performance Visualization
#Financial Plans and Performance #Diagram #Income Statement
-

Structure Presentation Template Diagram1 – Visualizing Operations and Workflow
#Business Management #Operational Plan #Diagram
-

Structural Map of Scientific Components – Effective Infographic Diagram
#Business Introduction #Business Vision and Strategy #Diagram
-

How to Use Exercise Equipment – Effective Usage Guidelines
#Product/Service Introduction #Diagram #Text Box
