Export Regional Distribution Strategy Diagram – An Essential Tool for Effective Marketing
RJ0800002_29
- Last Update 07/31/2025
- File Size 0.8MB
- # of Slides 2
- File Format PPTX
- Slide Ratio 16:9
- Color
Keywords
- #Content-Based Slides
- #Design-Based Slides
- #Marketing Plan and Strategy
- #Text Box
- #Other
- #Promotion Strategy
- #Distribution Strategy
- #Map
- #Rounded Rectangle Text Box
- #16:9
- #regional distribution strategy slide
- #distribution strategy PowerPoint diagram
- #marketing strategy comparison PPT
- #export strategy presentation slide
- #two-column comparison diagram PowerPoint
About the Product
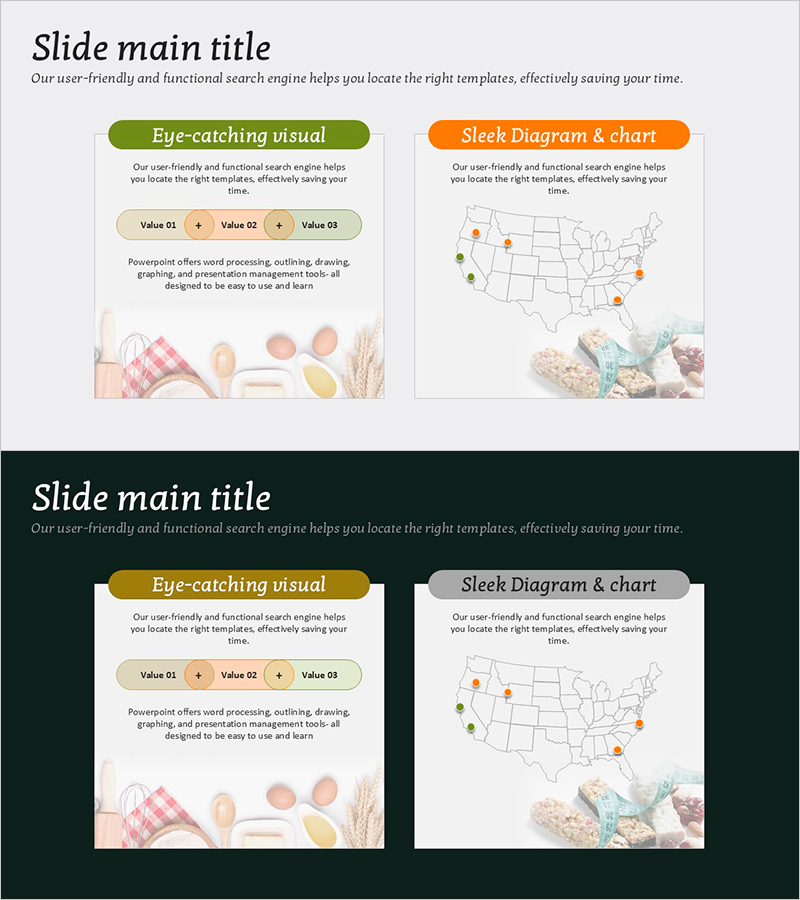
A 2-slide PowerPoint presentation designed to visualize export and regional distribution strategies. The layout features a contrasting two-column design with a green section on the left and an orange section on the right, enabling side-by-side comparison of two marketing approaches. Each slide includes a title area at the top, three value input boxes in the center (Value 01, 02, 03), and an image area at the bottom for visual reinforcement. The clear information hierarchy makes it ideal for business proposals, marketing presentations, and executive briefings.
Usage Points
-
Main Usage
Visualizes key elements of export and regional distribution strategies using a left-right comparison structure to support decision-making. Effectively presents two strategic directions simultaneously in marketing plans, business proposals, and executive reports.
-
How to Use
Enter strategy names (e.g., online channel, offline channel) in each section's title area. Fill the center text boxes with detailed content and key metrics. Add relevant images or icons in the bottom area to enhance visual impact and engagement.
-
Recommended For
Marketing managers, sales strategy teams, business planners, and export-import departments explaining regional or channel-based distribution strategies. Suitable for investor presentations, executive briefings, and team meeting materials.
-
Slide Structure
Two-slide deck with each slide featuring a title area with rounded rectangle background, three center input fields for values, and a bottom image zone. Green and orange color separation clearly distinguishes the two strategic approaches.
Related Products
-

Fruit Importers and Proportions – Global Distribution Strategy
#Company Introduction #Marketing Plan and Strategy #Graph
-

Diet Management Methods by Country – A Global Approach
#Company Introduction #Marketing Plan and Strategy #Diagram
-

World Map Data Slide | Regional Statistics Visualization PPT
#Market and Competitor Analysis #Marketing Plan and Strategy #Other
-

Global Export Area Map Slide – Business Opportunities
#Business Introduction #Marketing Plan and Strategy #Other
