Case Study: Impact of AI-Powered Medical Technologies in Hospitals
RJ0700030_3
- Last Update 07/30/2025
- File Size 0.9MB
- # of Slides 2
- File Format PPTX
- Slide Ratio 16:9
- Color
Keywords
- #Content-Based Slides
- #Design-Based Slides
- #Product/Service Introduction
- #Customer Success Stories
- #Diagram
- #Benefits and Advantages
- #Introduction of Key Customers
- #Structure
- #Tree Diagram
- #16:9
- #parallel comparison diagram PowerPoint
- #arrow diagram slide template
- #medical technology case study presentation
- #hospital performance metrics slide
- #how to create comparison diagram in PowerPoint
About the Product
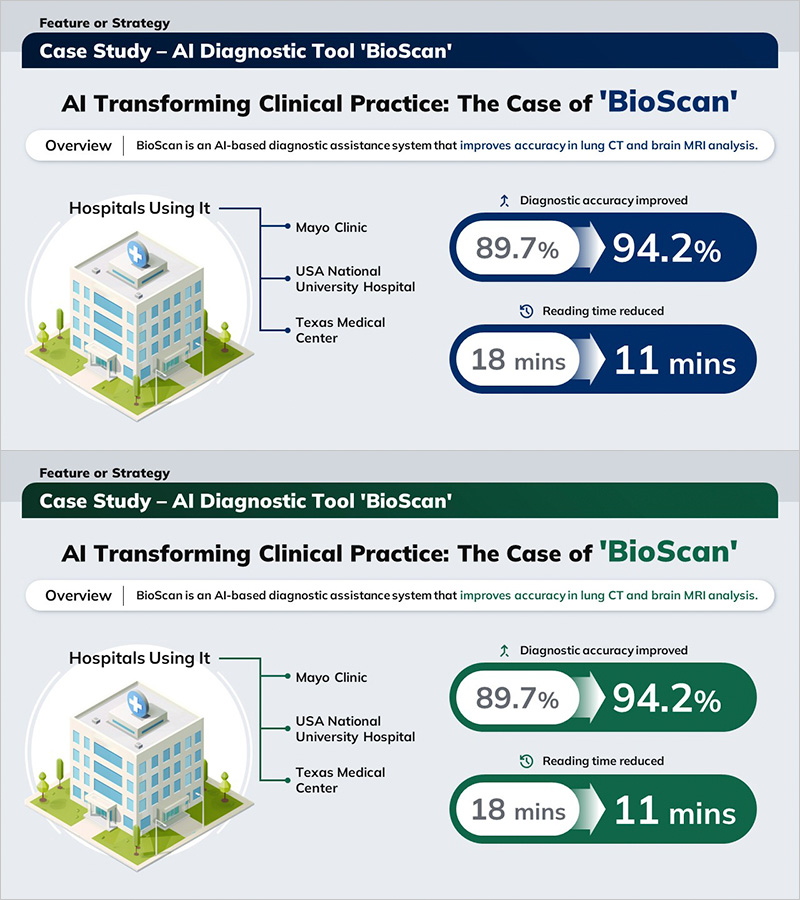
A parallel comparison diagram PowerPoint slide that visualizes AI medical technology adoption outcomes in hospitals. This presentation template features a three-stage structure connecting input metrics on the left to result metrics on the right via gradient arrows, enabling instant comparison of diagnostic accuracy improvements and reduced reading time. The navy background with white typography and directional arrows emphasizes medical credibility and professional expertise. This 2-slide set is ready to use for hospital case study presentations, medical technology performance reports, and diagnostic tool effectiveness demonstrations.
Usage Points
-
Main Usage
Presents before-and-after medical technology outcomes using a parallel structure that enhances audience comprehension and persuasiveness. The arrow-connected input and output values clearly communicate cause-and-effect relationships and improvement metrics.
-
How to Use
Deploy in hospital technology adoption presentations, diagnostic tool effectiveness reports, and medical AI solution marketing decks. Edit text and metrics in each stage to customize for various medical technology case studies and institutional contexts.
-
Recommended For
Hospital executives, medical technology managers, healthcare marketing teams, medical device sales professionals, and healthcare consultants presenting technology ROI. Suitable for academic presentations, conference materials, and C-suite briefings.
-
Slide Structure
2-slide set with parallel comparison layout. Each slide contains 3 stages: left input metrics → center gradient arrows → right output metrics. Navy background with white text boxes, 3 directional gradient arrows pointing right, icon areas, and editable metric fields at each stage.
Related Products
-

Highlighting the Efficacy of Blueberries – Data Visualization and Business Strategy
#Product/Service Introduction #Business Strategy #Diagram
-

Combination of Academic Thinking and Business Strategy - Effective Diagram Template
#Product/Service Introduction #Diagram #Product/Service Introduction
-

Modern Simple Organizational Chart Diagram – Clear Visualization of Technical Structure
#Company Introduction #Technical Approach #Diagram
-

Business Process Organization Chart – Visualizing Company Structure
#Company Introduction #Technical Approach #Diagram
