Failure Cause Analysis Graph – Market Analysis and Future Outlook
RL0100063_3
- Last Update 01/22/2025
- File Size 0.7MB
- # of Slides 2
- File Format PPTX
- Slide Ratio 4:3
- Color
Keywords
About the Product
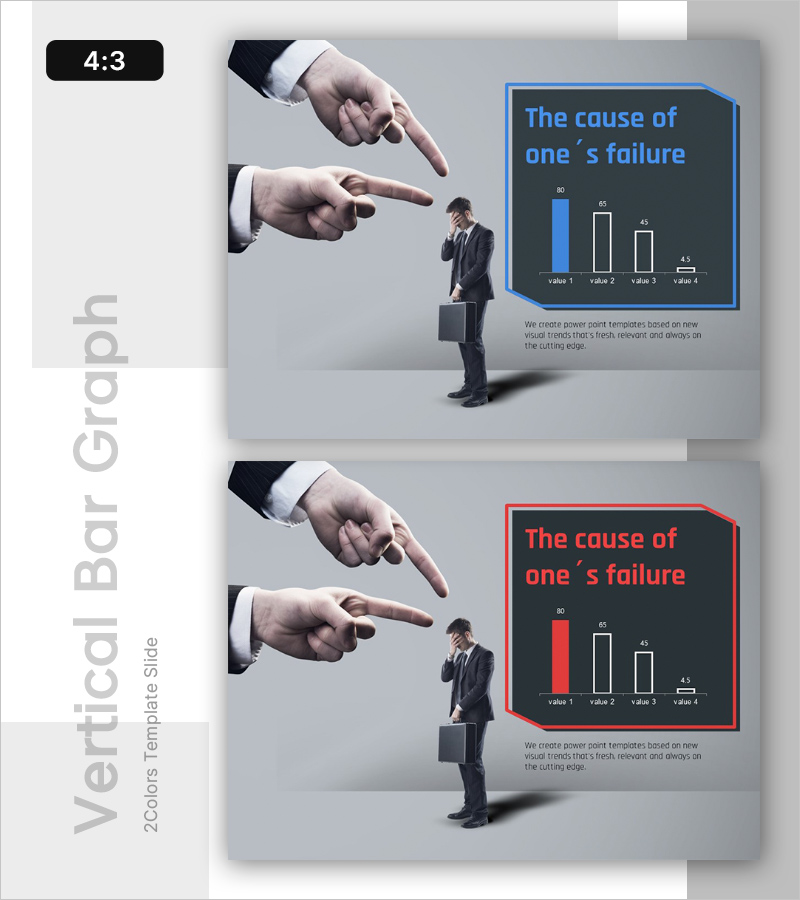
A horizontal bar chart PowerPoint slide that quantitatively analyzes and compares business failure factors. This presentation template includes two versions—blue accent and red accent—in 4:3 ratio PPTX format, ready for immediate editing. The right side features a title text box and a horizontal bar graph displaying four data values, while the left side showcases a businessman image with pointing gesture for visual impact. Ideal for market analysis presentations, risk assessment reports, executive briefings, and strategic planning sessions where failure causes and risk factors need to be communicated clearly to stakeholders.
Usage Points
-
Main Usage
This slide quantitatively presents business failure factors, risk elements, and problem areas to executives, investors, and team members. The four-item horizontal bar graph enables instant comparison and identification of the most significant impact factors in your analysis.
-
How to Use
Enter your analysis title in the text box on the right side, then replace the graph data values with your actual research findings. Use the blue version for positive or stable-tone presentations, and the red version when emphasizing urgency or risk factors.
-
Recommended For
Recommended for executives, business analysts, consultants, and strategists presenting in executive reports, investor pitch meetings, business evaluation sessions, risk management presentations, market analysis briefings, and consulting reports where failure causes and improvement areas must be explained with data-driven evidence.
-
Slide Structure
The template consists of two slides with identical layouts but different color schemes. The left 50% contains the businessman image area, while the right 50% is divided into a title text box (one field) and a horizontal bar graph area (displaying four data values with labels).
Related Products
-

Comparative Analysis of Our Own Competitiveness – Effective Market Analysis Slide
#Emotional Messages
-

Success Strategies for Overcoming Failure – Innovative Approach
#Emotional Messages
-

Failure Factor Analysis Procedure Diagram
#Emotional Messages
-

Business Failure Preparedness Template Cover
#Emotional Messages
