AI Global Target Market Map – Strategic Insights for Global Expansion
RJ0700025_8
- Last Update 07/29/2025
- File Size 1.4MB
- # of Slides 2
- File Format PPTX
- Slide Ratio 16:9
- Color
Keywords
- #Content-Based Slides
- #Design-Based Slides
- #Company Introduction
- #Market and Competitor Analysis
- #Diagram
- #Other
- #Global Network
- #Target Market
- #Cluster
- #Closed Cluster Diagram
- #Map
- #16:9
- #world map PowerPoint slide
- #global market map template
- #regional target market diagram
- #global network PPT
- #international business map presentation
- #how to create world map in PowerPoint
About the Product
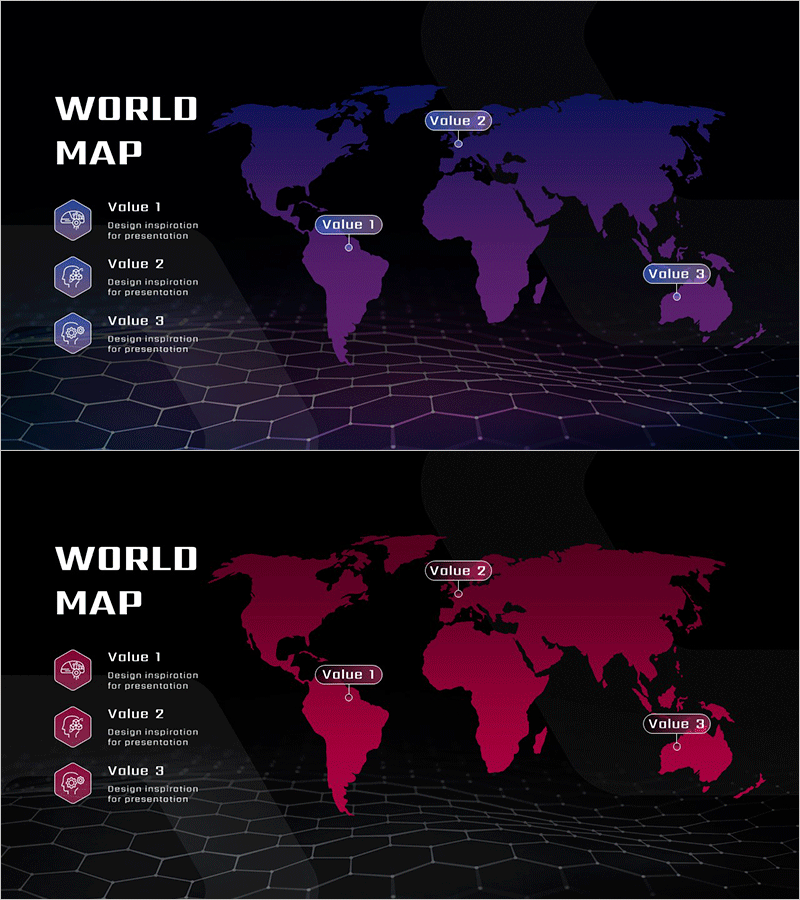
A world map PowerPoint slide that visualizes global business strategy with three key regions highlighted. The slide features a dark background with deep blue and wine-red color schemes to clearly distinguish target markets. The 2-slide set displays Value labels on North America, Europe, and Asia-Pacific regions to communicate market priorities intuitively. A hexagonal grid pattern at the bottom symbolizes global network connectivity and data relationships. The left-side icon legend explains each region's significance. Ideal for international market expansion presentations, global strategy discussions, and regional business planning reports.
Usage Points
-
Main Usage
Visually represents regional priorities of target markets in global business strategy. The world map displays three major regions with color-coded distinctions and Value labels, clearly communicating international market entry plans, regional business expansion, and global growth roadmaps.
-
How to Use
Use in international business presentations, global marketing strategy meetings, and regional sales planning reports. Click each region's Value label to edit text and modify region colors to adjust priority levels as needed. The hexagonal grid at the bottom emphasizes global network connectivity.
-
Recommended For
International business managers, global marketing teams, overseas expansion strategists, and multinational executives. Suitable for new market entry planning, regional performance analysis, and global partnership proposals.
-
Slide Structure
2-slide set. Each slide features a world map background with three regions (North America, Europe, Asia-Pacific) color-coded and labeled with Value 1, 2, and 3. A 3-icon legend on the left explains each region. A hexagonal grid pattern at the bottom represents global network connectivity.
Related Products
-

Map of Water Industry Status by Country – Emphasizing Global Network
#Company Introduction #Market and Competitor Analysis #Diagram
-

Global Target Country Analysis – Strategic Market Insights
#Company Introduction #Market and Competitor Analysis #Diagram
-

Targeting the Global Market – Effective Targeting Strategy Introduction
#Company Introduction #Market and Competitor Analysis #Diagram
-

Analysis of US Target Regions – Strategic Marketing and Opportunities
#Market and Competitor Analysis #Marketing Plan and Strategy #Diagram
