Dynamic Gauge Slide Emphasizing Achievements – Vision and Challenge
RJ0700024_29
- Last Update 07/29/2025
- File Size 3.1MB
- # of Slides 2
- File Format PPTX
- Slide Ratio 16:9
- Color
Keywords
About the Product
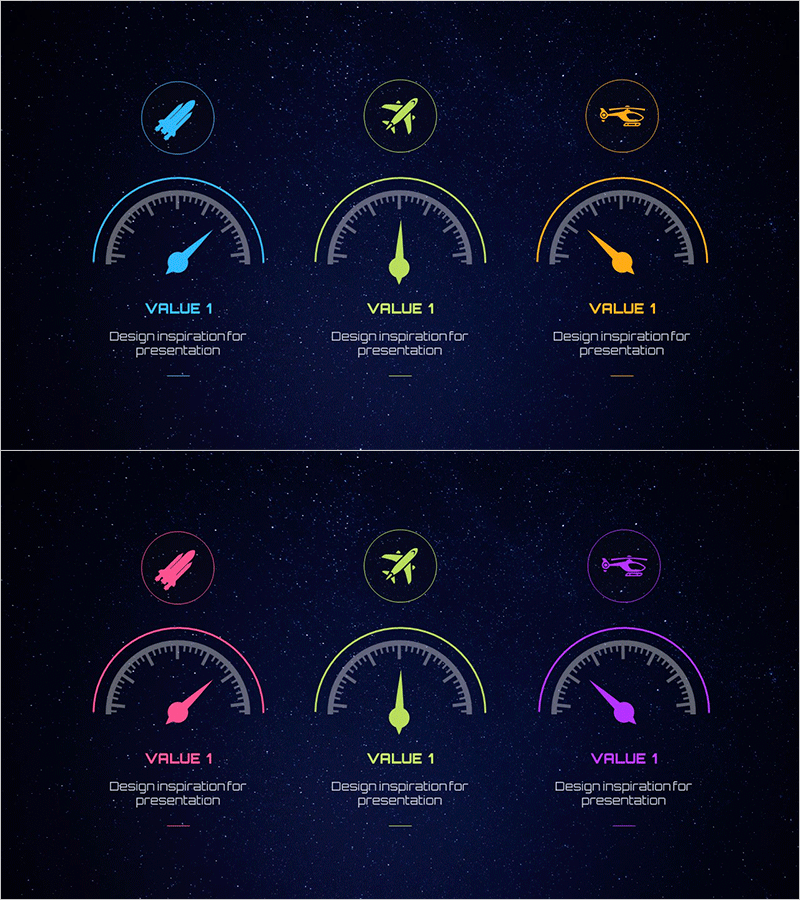
A dynamic gauge diagram PowerPoint slide that visually emphasizes performance and vision. Set against a dark navy background, three independent gauge elements in blue, yellow, and orange are arranged horizontally, each topped with an icon (rocket, airplane, helicopter). The 2-slide set includes a bright color version on the first slide and alternative tones in pink, yellow, and purple on the second. This infographic slide effectively communicates performance metrics, goal achievement rates, and vision levels at a glance in presentations.
Usage Points
-
Main Usage
Visualizes organizational performance metrics, goal achievement rates, and vision levels using gauge format to communicate intuitively to audiences. Highly effective for executive reports, business performance presentations, and strategic planning meetings to highlight key performance indicators (KPIs).
-
How to Use
Each gauge element is independently editable, allowing you to adjust values and labels to reflect actual organizational metrics or goal achievement rates. Customize colors and icons to match your presentation theme. Choose from two color variations to suit different presentation contexts.
-
Recommended For
Executive and management reports, business performance presentations, quarterly and annual performance reviews, strategic planning sessions, investor presentations, and organizational vision-sharing meetings. Suitable for marketing, sales, and operations departments to visualize performance metrics.
-
Slide Structure
Three independent gauge elements arranged horizontally on a dark navy background. Each gauge features a semicircular scale design with an icon above (rocket, airplane, helicopter), 'VALUE 1' label, and descriptive text below. The 2-slide set includes a bright color version (blue, yellow, orange) and an alternative tone version (pink, yellow, purple).
Related Products
-

Smart Network Characteristics Diagram – Business Goals and Vision
#Product/Service Introduction #Business Vision and Strategy #Diagram
-

Marketing Core Objectives Diagram - Strategic Goal Setting
#Business Vision and Strategy #Marketing Plan and Strategy #Diagram
-

Diagram Slide for Smart Network Business Goals
#Business Vision and Strategy #Marketing Plan and Strategy #Diagram
-

Newspaper Wide PowerPoint Template Diagram3 - Business Objectives and Strategy
#Business Vision and Strategy #Diagram #Business Goals
