Laboratory Visual Diagram Slide – More Choices and Visual Trends
RJ0700021_22
- Last Update 07/28/2025
- File Size 1.2MB
- # of Slides 2
- File Format PPTX
- Slide Ratio 16:9
- Color
Keywords
About the Product
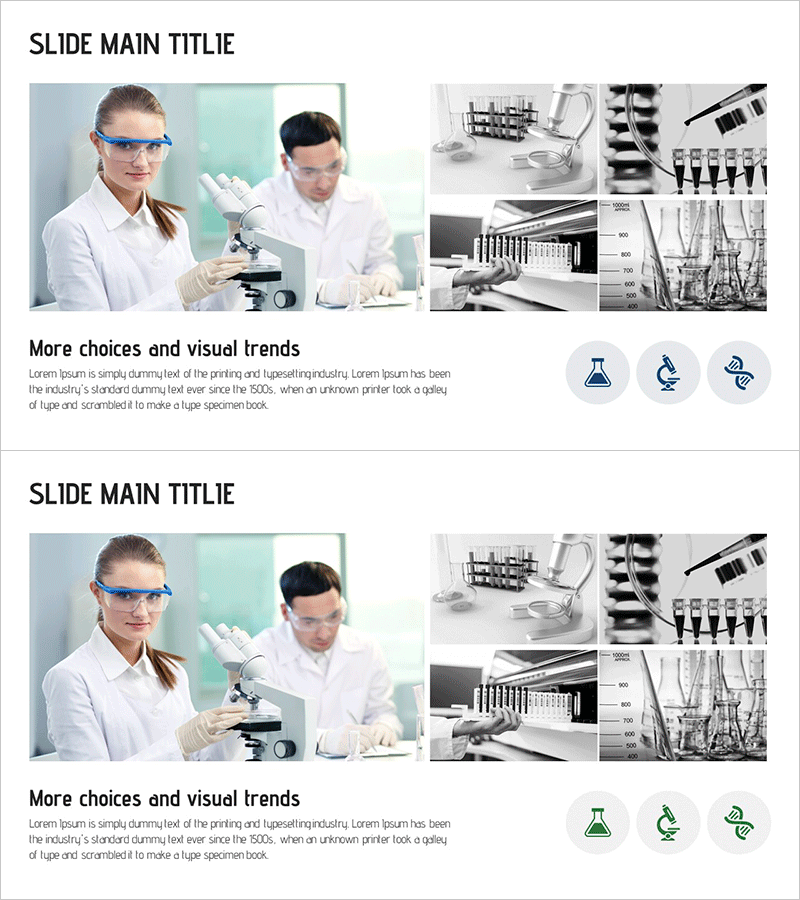
A professional PowerPoint slide template designed for science and technology presentations. Perfect for researchers, scientists, and technical teams presenting business strategy, technological innovation, and R&D initiatives. The slide layout features laboratory personnel and microscope imagery on the left side, complemented by black-and-white laboratory equipment photos on the right. Three science icons (flask, microscope, DNA) are positioned at the bottom to emphasize technical credibility and innovation. This 16:9 widescreen 2-slide set is ready for immediate editing and deployment in your presentation.
Usage Points
-
Main Usage
Provides a credible visual foundation for presenting business strategy, technological breakthroughs, and research outcomes in science, technology, and R&D sectors. Laboratory imagery and science icons enhance technical authority and capture audience attention.
-
How to Use
Add company logos and key messages to the left image area. Layer text, charts, and data over the right-side laboratory equipment imagery. Customize the bottom icons to represent your research field or technology focus, or modify colors for emphasis.
-
Recommended For
Ideal for technology-driven companies in pharmaceuticals, biotech, IT, energy, and medical sectors. Suitable for executive presentations, investor pitches, academic seminars, R&D progress reports, and product launch presentations.
-
Slide Structure
2-slide configuration with 50% left image area (laboratory personnel and equipment photography) and 50% right content area for text and data. Bottom section features 3 customizable science icons. Optimized for 16:9 widescreen format in modern presentation environments.
Related Products
-

Business Area Circular 3D Diagram – Introducing Strategic Vision
#Business Introduction #Business Vision and Strategy #Diagram
-

Criminal Trial Diagram – Business Strategy and Overview
#Business Introduction #Business Vision and Strategy #Diagram
-

Blue Pink Business Strategy Slide – Vision and Flow
#Business Introduction #Business Vision and Strategy #Business Overview
-

Cylinder Shape Diagram for Business Strategy Visualization
#Product/Service Introduction #Business Vision and Strategy #Diagram
