Versatile Graph Slide in Contemporary Colors and Styles
RJ0700021_17
- Last Update 07/28/2025
- File Size 0.4MB
- # of Slides 2
- File Format PPTX
- Slide Ratio 16:9
- Color
Keywords
About the Product
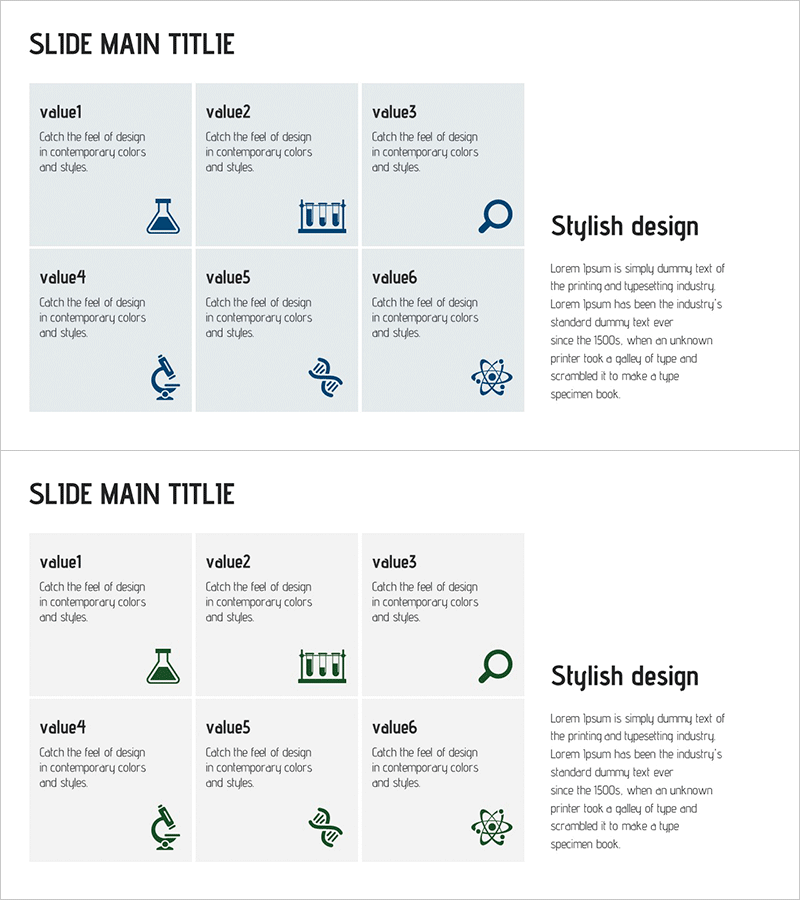
A versatile 6-item comparison graph PowerPoint slide optimized for business vision and strategy presentations. Featuring a light blue background with icons and text input areas arranged in a balanced 2-slide layout, this template enables you to visually communicate product features, service values, competitive advantages, and more. Each item includes dedicated space for descriptive text and icons, allowing you to clearly structure your company's core messages. Ideal for presentations, planning documents, and reports across multiple business contexts.
Usage Points
-
Main Usage
This slide simultaneously compares and explains 6 key items such as company values, product features, and service differentiation. In the business vision section, it visually expresses your company's strengths and strategic direction, delivering credible messages to investors, partners, and employees.
-
How to Use
Enter your company information in each item's text input area and replace icons to match your brand identity. During presentations, you can explain each item sequentially or use the layout to compare all items at once for comprehensive impact.
-
Recommended For
Ideal for business plans, company profiles, investor pitch decks, and marketing proposals where you need to explain vision, strategy, and competitive advantages. Suitable for startups, SMEs, and large enterprises in executive briefings, external presentations, and proposal documents.
-
Slide Structure
2-slide layout with 6 equally-sized boxes arranged in a 2-row, 3-column grid on each slide. Each box contains icon space and text input area, with an additional description text section on the right side for clear information hierarchy and detailed explanations.
Related Products
-

Strategic Vision Expansion Diagram
#Product/Service Introduction #Business Vision and Strategy #Diagram
-

Pyramid Infographic Slide | 5-Point Value Structure PPT
#Product/Service Introduction #Business Vision and Strategy #Diagram
-

Capture Space Launch Success with Stylish Design – Innovation and Growth
#Product/Service Introduction #Product/Service Introduction #Composition
-

Stylish Design Presentation Template
#Product/Service Introduction #Composition #Cluster
