Innovative Space Industry Schedule – Advanced Operations and Implementation Strategy
RJ0700020_29
- Last Update 07/27/2025
- File Size 1.4MB
- # of Slides 2
- File Format PPTX
- Slide Ratio 16:9
- Color
Keywords
- #Content-Based Slides
- #Design-Based Slides
- #Business Management
- #Operational Plan
- #Diagram
- #Implementation Schedule
- #Project Implementation Schedule
- #Table
- #16:9
- #schedule timeline PPT slide
- #Gantt chart PowerPoint template
- #project schedule management slide
- #monthly timeline PowerPoint
- #how to create a Gantt chart in PowerPoint
About the Product
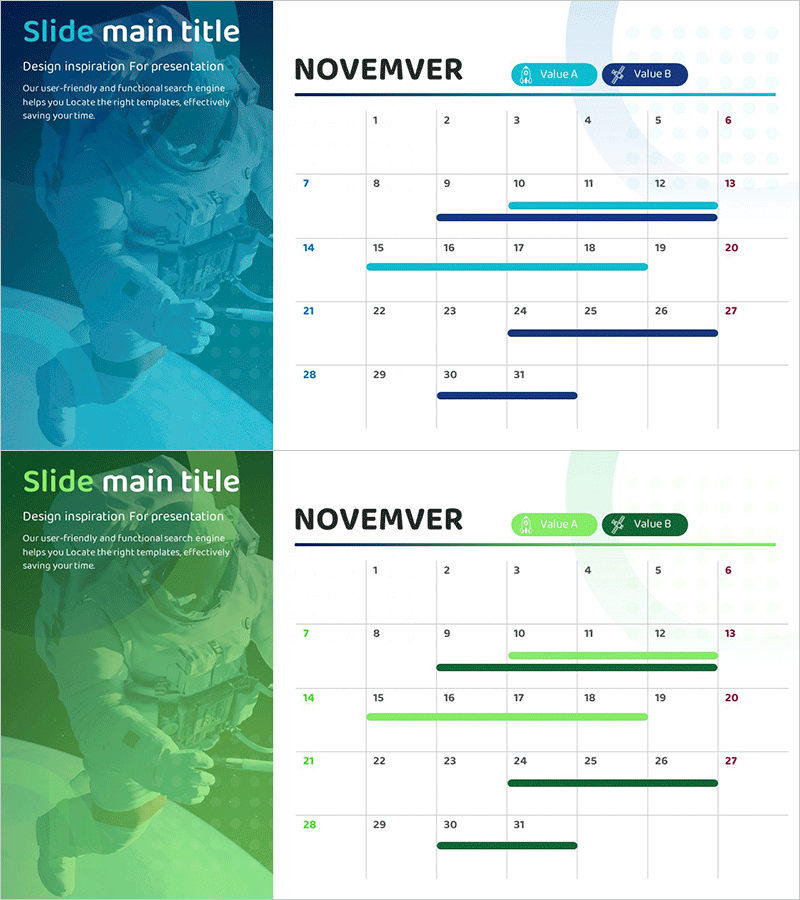
A Gantt chart-style PowerPoint slide for visualizing project schedules and operational plans. Available in two color versions—dark blue with light blue accents and green tones—this slide presents monthly timelines using horizontal bars to display project progress at a glance. Each slide features a title area on the left and a calendar-based layout on the right, with Value A and Value B legend markers enabling simultaneous tracking of two schedule items. Ideal for business management, operational planning, and strategic execution presentations where timeline clarity is essential.
Usage Points
-
Main Usage
Visualize project schedules and operational timelines using a Gantt chart format to communicate progress clearly to team members and stakeholders. Horizontal bars represent start, end, and duration of each task, with dual-item comparison capability for tracking multiple initiatives simultaneously.
-
How to Use
Insert into business plans, operational plans, or project proposals in the 'Implementation Timeline' or 'Execution Plan' section. The monthly calendar format suits quarterly and annual planning presentations, project kickoff meetings, and progress status reports across various industries.
-
Recommended For
Project managers, operations specialists, strategic planning teams, and business development professionals communicating schedule plans and progress visually. Particularly valuable in space industry, manufacturing, IT, construction, and other sectors requiring long-term project management.
-
Slide Structure
Two-slide set offering blue-tone and green-tone color versions. Each slide contains a left-side title area for text input and a right-side November calendar-based Gantt chart with Value A and Value B legend markers for dual-item timeline tracking.
Related Products
-

Geometry PPT Template Wide Schedule – Essential for Project Management
#Business Management #Operational Plan #Diagram
-

Origami Presentation Template Section Schedule – Business Progress Management
#Business Management #Operational Plan #Diagram
-

Overseas Travel Business Promotion Schedule Plan – Effective Preparation Strategies
#Business Management #Operational Plan #Diagram
-

Displays the Schedule Step by Step – Clear Communication of Project Timeline
#Business Management #Operational Plan #Diagram
