Income Statement Table – Easily Understand Financial Information
RJ0700020_18
- Last Update 07/27/2025
- File Size 1.1MB
- # of Slides 2
- File Format PPTX
- Slide Ratio 16:9
- Color
Keywords
About the Product
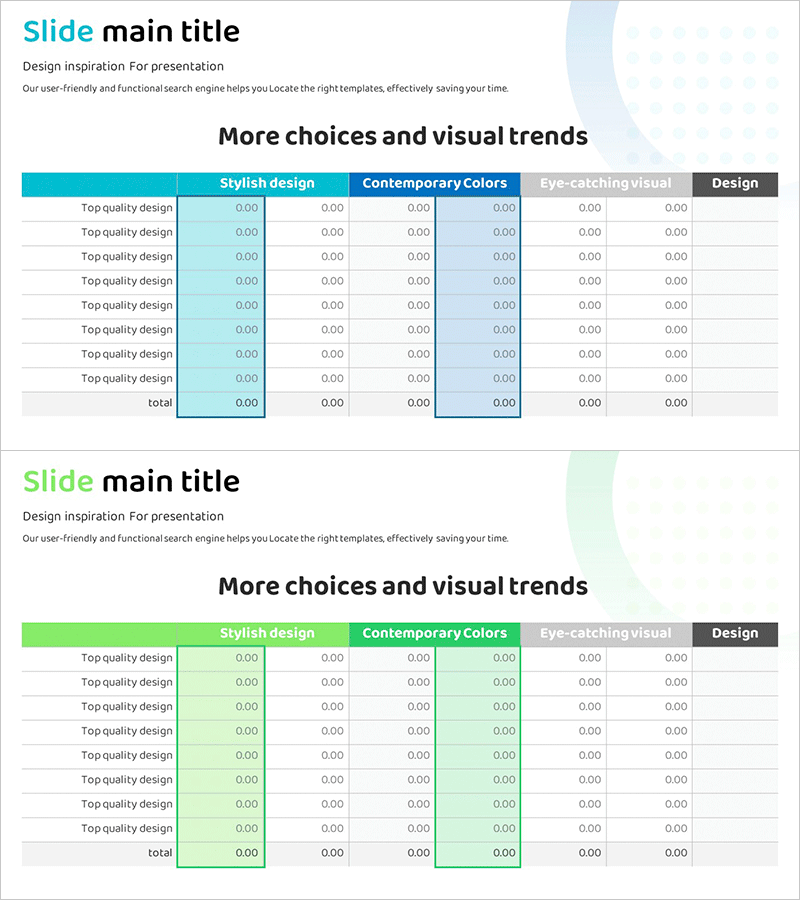
A financial data table PowerPoint slide designed to clearly organize and compare income statement information. The horizontal table structure features 6 columns and 8 rows, allowing you to display financial figures side by side for easy comparison. The teal header row and white data cells create strong visual contrast that emphasizes key financial metrics. Two identical slides enable you to present multiple periods or scenarios simultaneously. This PPT slide template is ready to use in business reports, investor presentations, and financial analysis meetings.
Usage Points
-
Main Usage
Organize and compare financial information systematically using a structured table format. Present income statements, financial statements, and business performance data with clear row-and-column separation. The teal header and white cell design ensures visual clarity, helping audiences quickly understand and analyze numerical data without confusion.
-
How to Use
Insert this slide into the financial performance section of business reports, investor pitch decks, quarterly earnings presentations, or annual financial reviews. Simply enter your numerical data into each cell or copy-paste existing figures from spreadsheets. The two-slide layout allows you to display comparative data across multiple periods or business scenarios, making trend analysis presentations more effective.
-
Recommended For
CFOs, financial controllers, business executives, investor relations managers, accounting consultants, and business analysts who regularly present financial information. Ideal for public company earnings calls, startup fundraising pitches, executive board meetings, financial audit presentations, and quarterly performance reviews.
-
Slide Structure
Two slides with identical 6-column by 8-row table layouts. The first column contains item labels (income statement line items), while the remaining five columns hold numerical data for different periods or scenarios. The header row features a teal background with white text for emphasis, while data rows use white backgrounds to maximize readability and data visibility.
Related Products
-

PowerPoint Template for Service Operation Strategy Presentation
#Business Management #Operational Plan #Technical Approach
-

Hexagonal Diffusion Diagram – Visualizing Business Overview
#Business Introduction #Diagram #Business Areas
-

Origami Vision Flow Diagram Template
#Business Strategy #Business Management #Diagram
-

Furniture Installation Process Slide – Multi-directional Flow Diagram
#Business Introduction #Business Vision and Strategy #Diagram
