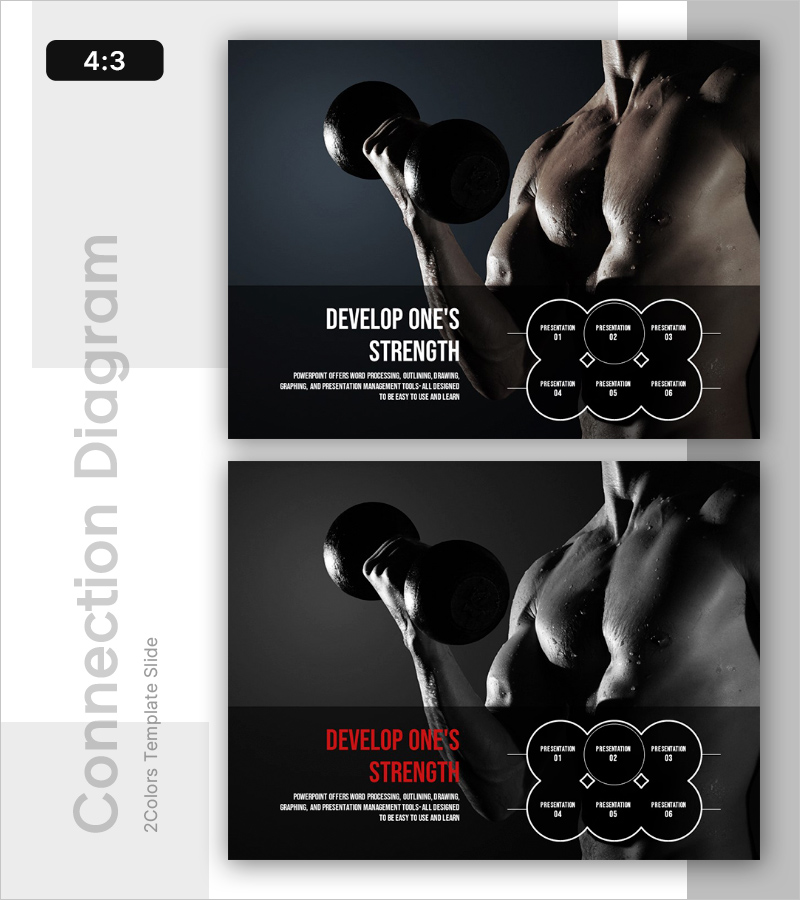
Build Your Strength – Infographic Slide for Business Success
RL0100059_3
- Last Update 01/21/2025
- File Size 1.6MB
- # of Slides 2
- File Format PPTX
- Slide Ratio 4:3
- Color
Keywords
About the Product
A 2-slide PowerPoint presentation template that visualizes business success and personal growth through a striking visual narrative. The design features a dark background with white typography and a 6-stage circular diagram layout, complemented by a dumbbell image that conveys strength and achievement. This presentation slide is ready to use in company introductions, vision statements, performance reports, and strategic growth initiatives. The 4:3 aspect ratio PPTX format ensures compatibility with all PowerPoint versions and allows full customization of text, colors, and imagery.
Usage Points
-
Main Usage
Communicate organizational growth strategies, individual capability development, and business success milestones through a structured visual framework. The 6-stage circular diagram clearly represents sequential processes, milestone achievements, and progressive goals while the strength imagery reinforces confidence and momentum.
-
How to Use
Integrate into company overview presentations, strategic planning sessions, organizational development program introductions, and performance report growth metrics sections. Customize each circular element with your content, adjust colors to match corporate branding, and replace the background image with company-specific visuals as needed.
-
Recommended For
Executive leadership presentations, investor pitch decks, HR and organizational development initiatives, startup growth roadmap explanations, and marketing strategy presentations showcasing customer success stories or brand evolution narratives.
-
Slide Structure
Two-slide layout with the first slide containing a title area (DEVELOP ONE'S STRENGTH), descriptive text, and supporting imagery. The second slide features six circular diagram elements arranged in a 2×3 grid, each with input fields for presentation content and diamond-shaped connectors indicating stage progression and relationships.


