Vertical Regular Bar Graph for Market Analysis – Emphasizing Speed
RL0100055_3
- Last Update 01/21/2025
- File Size 0.8MB
- # of Slides 2
- File Format PPTX
- Slide Ratio 4:3
- Color
Keywords
About the Product
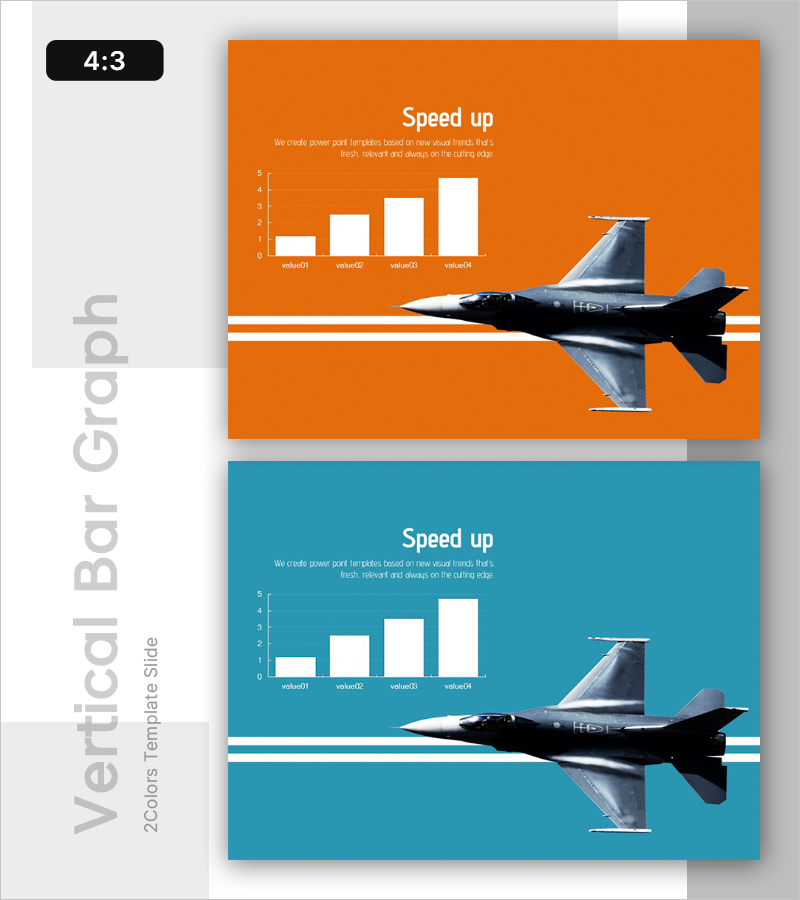
A vertical bar chart PowerPoint slide designed to visualize performance and success metrics. The slide features an orange background with four white bars representing four data stages (value01 through value04), clearly showing growth progression and comparative analysis. The layout includes a title section, descriptive text, and labeled data points, making it ideal for market analysis, competitive benchmarking, and performance reporting. Available in 4:3 ratio PPTX format for immediate editing. The dynamic jet aircraft imagery reinforces momentum and upward trajectory in your presentation.
Usage Points
-
Main Usage
Visualize step-by-step growth trends, performance comparisons, and market analysis data with clarity and impact. The four-bar structure effectively communicates rising metrics and success indicators, while the aircraft imagery conveys speed and innovation simultaneously.
-
How to Use
Insert this slide into quarterly business reports, marketing analysis presentations, or investor briefings. Replace the title and description text with your content, then input actual figures into the value01–value04 labels. The slide is ready to use immediately after data entry.
-
Recommended For
Finance teams, marketing departments, and executives presenting quarterly results, market share growth, or customer satisfaction trends. Particularly effective for investor relations materials, annual business reports, and strategic planning meetings where performance emphasis is critical.
-
Slide Structure
Two-slide set offering orange and teal background color options. Each slide contains a title area (Speed up), one-line descriptive text, a four-stage vertical bar chart, and an image area on the right. All text, labels, and data values are fully editable to match your specific metrics.
Related Products
-

Successful Business Presentation Template Cover
#Emotional Messages
-

Competitive Sports Template Cover – Challenge and Achievement
#Emotional Messages
-

Competitive Advantage Analysis Bar Chart – Visualization Emphasizing Market Competition
#Emotional Messages
-

Knowhow Template Ending Cover
#Emotional Messages
