Visualizing Research and Development Progress – Technical Insights
RJ0700012_15
- Last Update 07/25/2025
- File Size 0.3MB
- # of Slides 2
- File Format PPTX
- Slide Ratio 16:9
- Color
Keywords
- #Content-Based Slides
- #Design-Based Slides
- #Business Introduction
- #Diagram
- #Graph
- #Technological Status
- #Cluster
- #Horizontal Bar
- #Closed Cluster Diagram
- #Horizontal Bar Chart
- #16:9
- #R&D progress diagram PowerPoint
- #technical progress chart
- #horizontal bar graph slide
- #cluster diagram template
- #research development status presentation
- #technical metrics visualization
About the Product
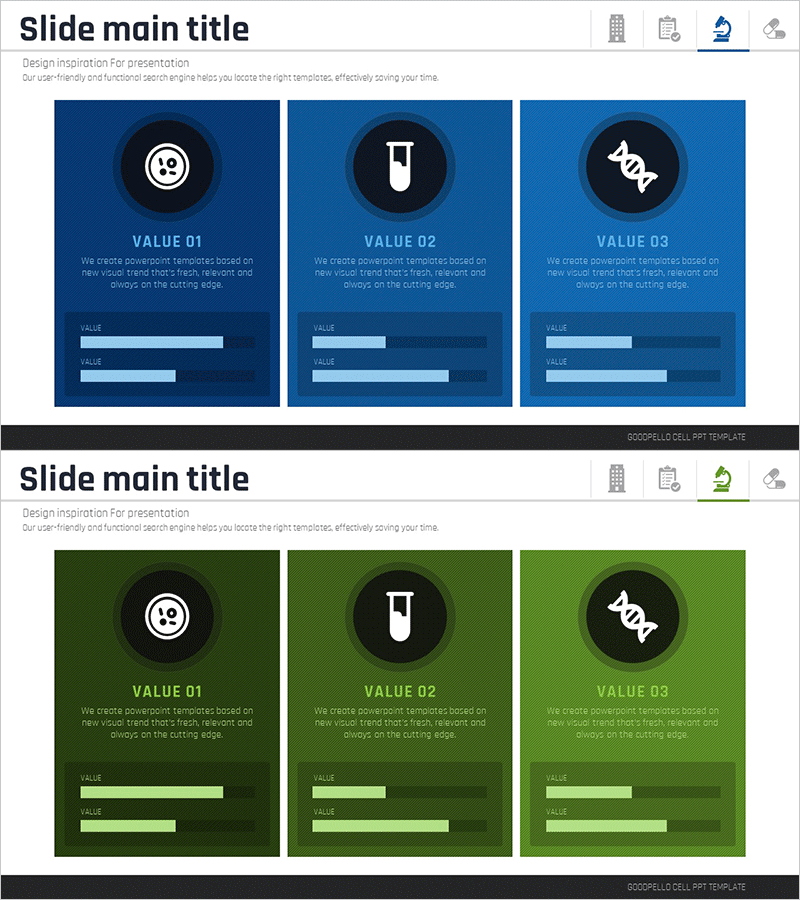
A professional PowerPoint slide that visualizes research and development project progress using both horizontal bar charts and cluster diagrams simultaneously. This presentation template clearly displays progress rates, technical indicators, and project status through numerical data and visual shapes, making it immediately applicable for technical team reports, R&D leadership updates, and executive presentations. The dark blue background with light blue accent colors creates a professional appearance suitable for conveying complex technical data intuitively. The 2-slide composition allows comparison of multiple progress metrics at a glance.
Usage Points
-
Main Usage
Quantitatively express research and development project progress rates, technical indicators, and completion status while simultaneously comparing and analyzing multiple R&D items. Effectively communicates technical team performance to executives and stakeholders.
-
How to Use
The first slide displays progress rates using horizontal bar charts, while the second slide represents relationships between technical elements through cluster diagrams. Input actual numerical values directly into each item for real-time progress updates, and reuse across monthly and quarterly reports.
-
Recommended For
Recommended for R&D directors, technical leaders, and project managers presenting progress status in executive meetings, board reports, and technical seminars. Ideal for quarterly and annual performance presentations in technology-intensive industries such as pharmaceuticals, semiconductors, software, and automotive.
-
Slide Structure
2-slide composition: Slide 1 features 5-item horizontal bar chart (0-100% progress display), Slide 2 contains 3-node cluster diagram (1 central node connected to 2 peripheral nodes). Dark blue background with light blue and white text creates strong contrast, and each slide can be used independently.
Related Products
-

Spring Fashion Item Recommendation Presentation Template – Embracing Trends and Styles
#Business Introduction #Operational Plan #Diagram
-

Highlighting Skincare Functions Slide – Product Introduction
#Product/Service Introduction #Business Introduction #Diagram
-

Camping Business Marketing Goal Diagram
#Business Introduction #Diagram #Technological Status
-

Work Life Icons Enhancing Slide Template
#Product/Service Introduction #Business Introduction #Diagram
