Distribution Graph by Donation Usage Items – Visualizing Charity and Hope
RL0100054_3
- Last Update 01/21/2025
- File Size 3.3MB
- # of Slides 2
- File Format PPTX
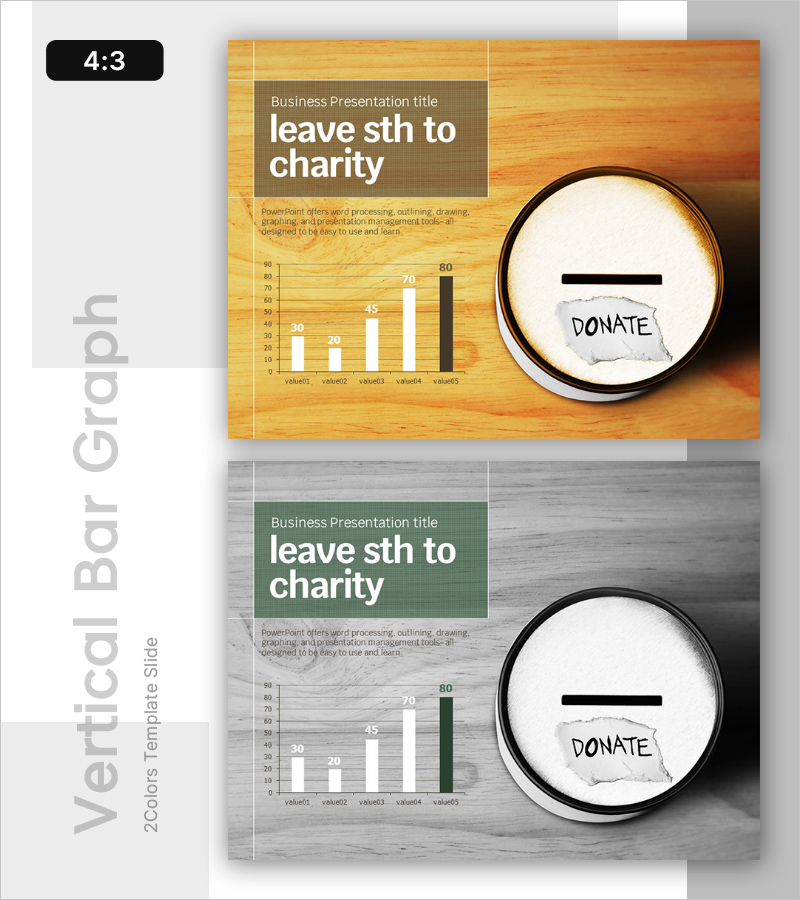
- Slide Ratio 4:3
- Color
Keywords
About the Product
A 2-slide PowerPoint presentation visualizing charitable giving and social contribution. The horizontal bar graph with wood-tone background and green accent color clearly displays the distribution of donation usage by category. The slide features a left text area and right circular diagram space, allowing simultaneous presentation of donation status and messaging. The 4:3 ratio slides are ready for immediate use in charity organizations, NGO presentations, and social welfare institutions, optimized for explaining donation allocation, transparency reporting, and fund distribution updates.
Usage Points
-
Main Usage
Clearly communicate donation allocation and fund distribution through numerical data and visual representation. Used by charitable organizations, social welfare agencies, and foundations for transparency reporting and fund allocation explanations, building trust with donors and stakeholders.
-
How to Use
Enter donation program descriptions or fund usage objectives in the left text box, modify the bar graph with category-specific allocation amounts or percentages, and place additional donation messages or information in the right circular diagram area for comprehensive donation status overview.
-
Recommended For
Recommended for charitable organizations, social welfare agencies, NGOs, foundations, and corporate social responsibility departments presenting donation allocation and fund usage. Suitable for donor briefing sessions, transparency reporting meetings, fund distribution updates, and social contribution activity reports.
-
Slide Structure
2-slide layout with each slide divided into three sections: left text input area (title and description), center horizontal bar graph (5 data categories), and right circular diagram space. Wood-tone and green color combination conveys both trustworthiness and growth potential.
Related Products
-

Tell the Truth Template Cover – Business Presentation
#Emotional Messages
-

Choice Template Cover – The Beginning of Professionalism and Possibility
#Emotional Messages
-

Future Outlook Analysis Graph – Visualizing Market Trends and Opportunities
#Emotional Messages
-

Tell the Truth Template Ending Cover
#Emotional Messages
