Future Outlook Analysis Graph – Visualizing Market Trends and Opportunities
RL0100032_3
- Last Update 01/20/2025
- File Size 2.4MB
- # of Slides 2
- File Format PPTX
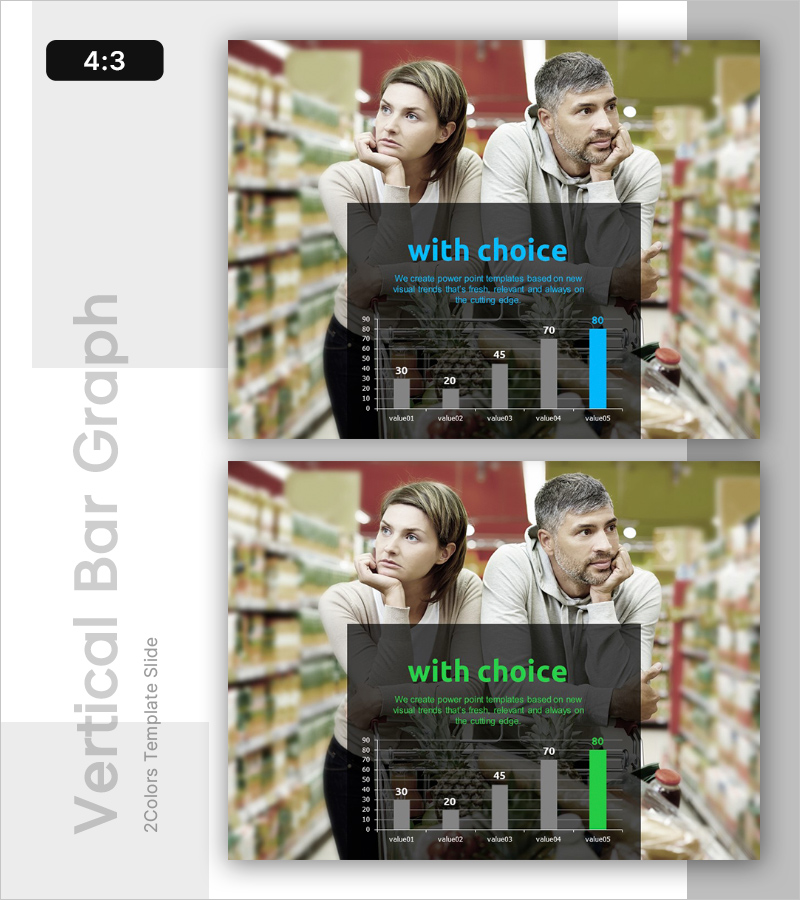
- Slide Ratio 4:3
- Color
Keywords
About the Product
A 2-slide PowerPoint presentation designed to visualize market analysis and future outlook. Features a dark background with blue and gray dual-tone bar charts comparing five data points, complemented by title and descriptive text areas that support data-driven decision-making. This presentation slide is ready to use immediately in market overview, competitive analysis, and opportunity assessment sections of business proposals. Compatible with standard PowerPoint templates in 4:3 aspect ratio PPTX format, with fully editable colors, values, and text fields for customization.
Usage Points
-
Main Usage
Present market conditions, competitive analysis, and future opportunities through data-driven comparison of five key metrics. Strengthens decision-making credibility in investor, executive, and partner presentations.
-
How to Use
Insert into the market analysis section of business plans, marketing strategies, or investor presentations to communicate five-point comparisons at a glance. Add analytical conclusions and insights in the text area to enhance audience comprehension.
-
Recommended For
Ideal for executives, marketing teams, strategic planning departments, and sales teams presenting market conditions. Particularly effective for new business proposals, market entry strategies, and competitive analysis presentations.
-
Slide Structure
Composed of title area (top blue text) + descriptive text section (middle) + five-item horizontal and vertical bar graph (bottom). Each item name and numerical value are clearly displayed for optimal data readability.


