Time Management Table Chart for Market Analysis Presentation
RL0100053_4
- Last Update 01/21/2025
- File Size 1.8MB
- # of Slides 2
- File Format PPTX
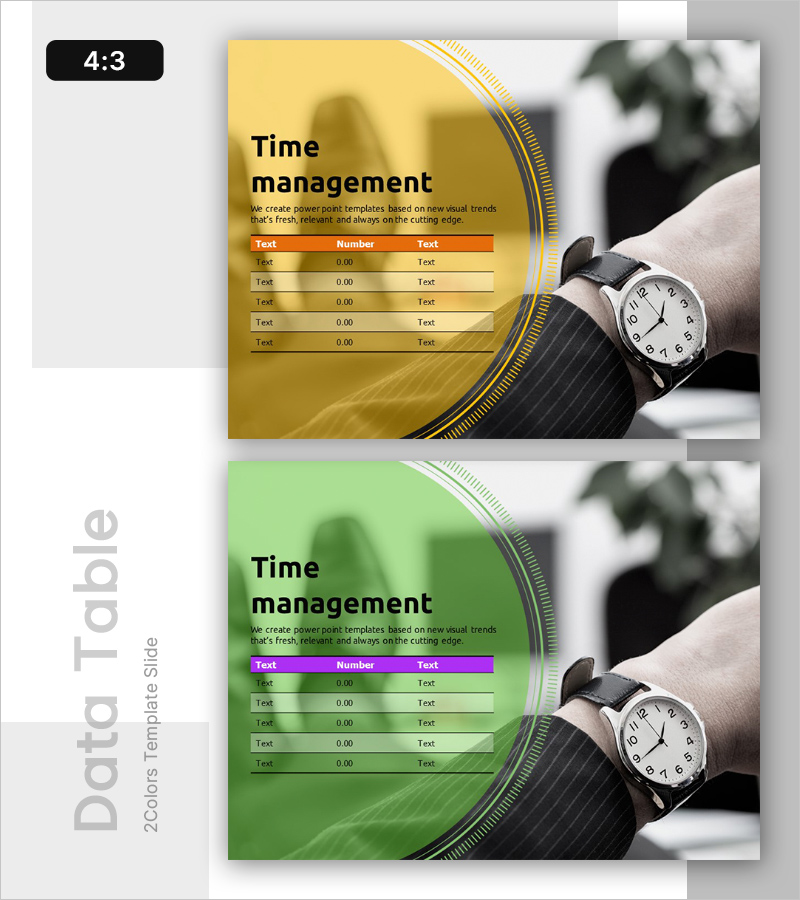
- Slide Ratio 4:3
- Color
Keywords
About the Product
A 2-slide PowerPoint set for visualizing time management and scheduling plans. Available in two color options—gold and green—each slide features a 3-column table structure (Text·Number·Text) with 5 rows for data entry. The layout combines a watch image with the table to emphasize the core message of time management. Ready to use immediately in business presentations, project planning, resource allocation, and operational reviews. Formatted in 4:3 ratio PPTX, fully editable in all PowerPoint versions.
Usage Points
-
Main Usage
Clearly visualize project timelines, resource allocation, and time distribution plans. Effectively communicate time-related data in table format during business management, operational planning, and strategy presentations.
-
How to Use
Enter relevant data (time, schedule, responsible party, budget) into each table cell. Select either gold or green color to match your presentation theme and tone. The watch image visually reinforces the importance of time management.
-
Recommended For
Project managers, operations specialists, and strategic planning teams explaining schedules and time allocation. Ideal for business plans, operational plans, project proposals, and quarterly objective presentations.
-
Slide Structure
2-slide set with title area (Time management), descriptive text, 3-column header (Text·Number·Text), and 5 data entry rows per slide. Watch image on the left and table on the right create a balanced, symmetrical layout.
Related Products
-

Business Idea Analysis Graph – Innovation and Vision
#Emotional Messages
-

Potential Template Cover – A Professional and Emotional Start
#Emotional Messages
-

AI Innovation Business Ideas Slide – Creative Visualization
#Emotional Messages
-

Introducing Positive Future Services – Creative Vision
#Emotional Messages
