Successful Future Prospect Analysis Graph
RL0100052_3
- Last Update 01/21/2025
- File Size 1.3MB
- # of Slides 2
- File Format PPTX
- Slide Ratio 4:3
- Color
Keywords
About the Product
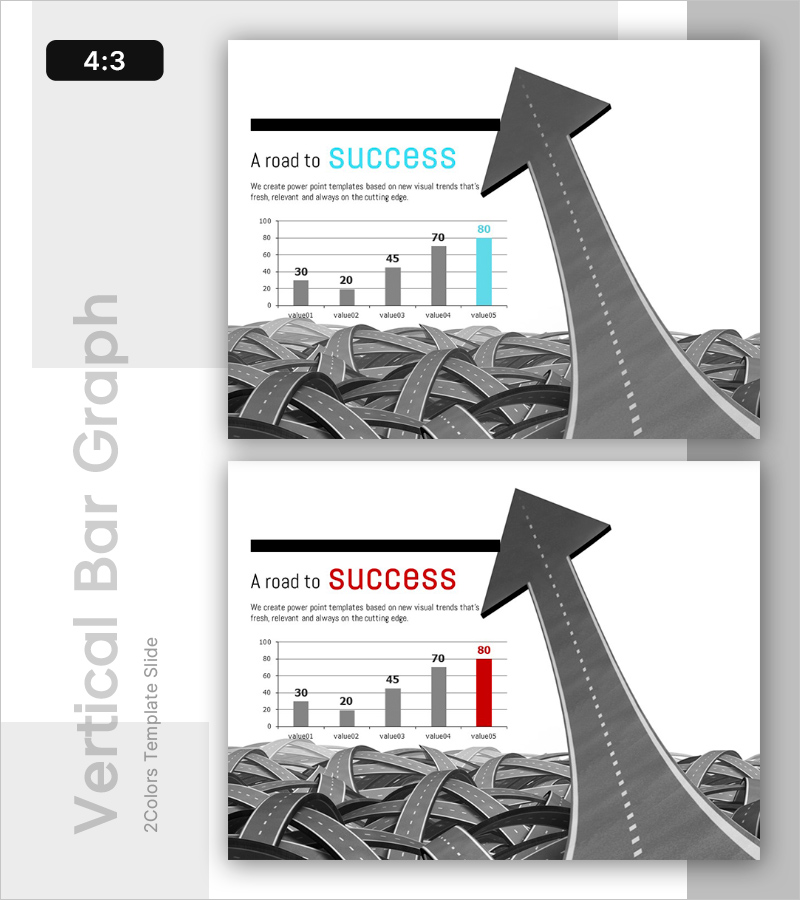
A 2-slide PowerPoint presentation visualizing successful future prospects through horizontal bar graphs. Each slide features a 5-step horizontal bar chart displaying performance metrics, with an upward arrow roadmap at the top and a road background at the bottom symbolizing the journey to success. Provided in 4:3 aspect ratio PPTX format, each slide includes data input areas and text spaces for titles and descriptions. Ready to use for market analysis presentations, performance reports, and business success case studies.
Usage Points
-
Main Usage
Visualizes business performance, success metrics, and future prospects through step-by-step numerical data. The 5-item horizontal bar graph clearly expresses comparative analysis, while the upward arrow roadmap emphasizes the progression toward success. Effectively communicates achievement pathways to investors, executives, and team members.
-
How to Use
Enter actual numerical values into the bar graph data areas and modify the title and description text. The first slide features blue accent color while the second uses red, allowing for comparative presentations or time-series analysis. The road background and arrow imagery remain fixed to maintain visual consistency throughout.
-
Recommended For
Ideal for executive reports, business performance presentations, investor relations (IR) meetings, marketing performance analysis, and quarterly or annual results reports. Particularly effective when explaining success cases, growth metrics, and goal achievement status with data-driven narratives. Suitable for consulting reports and strategic planning meetings.
-
Slide Structure
2-slide format with each slide containing a title area at top (A road to SUCCESS), a 5-step horizontal bar graph in the center (value01-value05, 0-100 scale), and a road background with arrow roadmap at the bottom. Includes 2 text input areas (title and description) and 5 data input areas (bar values).
Related Products
-

Speed Template Intro – Kickstart Your Presentation with Speed
#Emotional Messages
-

Competitive Advantage Analysis Bar Chart – Visualization Emphasizing Market Competition
#Emotional Messages
-

Competitive Sports Template Intro – The Beginning of Strategy and Challenge
#Emotional Messages
-

Economic Consumption Template Intro
#Emotional Messages
