Stress Index Analysis Graph – Market Share Comparison
RL0100049_3
- Last Update 01/21/2025
- File Size 4.2MB
- # of Slides 2
- File Format PPTX
- Slide Ratio 4:3
- Color
Keywords
About the Product
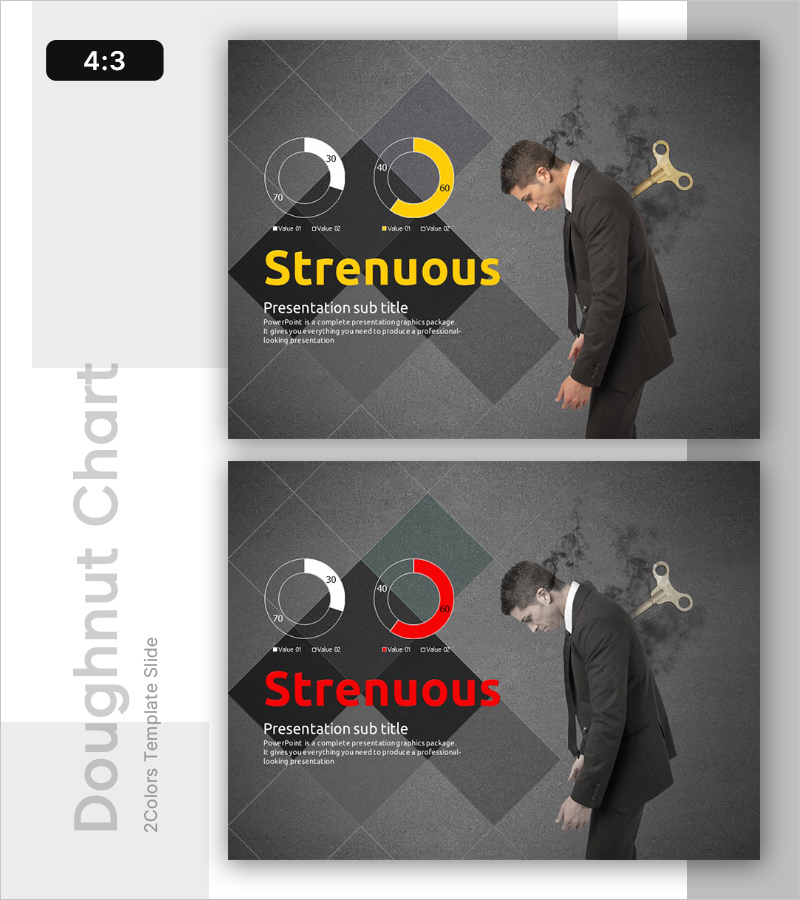
A professional doughnut chart PowerPoint slide for comparing stress index and market share data side by side. Dark gray background with yellow and red accent colors creates strong visual contrast for data differentiation. Two circular graphs positioned on the left with numerical labels and legends, while the right side features a businessman image and gear icon for dynamic visual impact. Ideal for financial reports, market analysis presentations, and executive briefings. Delivered in 4:3 aspect ratio PPTX format with 2 slides, allowing flexible color variations (yellow/red) to emphasize different data points and adapt to various presentation contexts.
Usage Points
-
Main Usage
Simplifies complex numerical data through doughnut chart visualization, enabling quick comprehension of market share, stress indices, and ratio comparisons. Yellow and red dual-color design emphasizes contrasting data sets, providing clear decision-making support for executives and stakeholders.
-
How to Use
Deploy in financial report market analysis sections, executive performance comparisons, and marketing strategy meetings for market overview presentations. The businessman image and gear icon on the right convey professionalism and dynamic energy, capturing audience attention and reinforcing business context.
-
Recommended For
Finance teams presenting quarterly results, marketing departments reporting market analysis, executive strategy meetings, investor relations presentations, and consulting firms preparing client proposals. Suitable for any data-driven business presentation requiring visual comparison of key metrics.
-
Slide Structure
Two-slide set with first slide featuring yellow-accented doughnut charts and second slide with red-accented charts. Each slide uses a three-column layout: left side with two circular graphs and numeric labels, center with title and subtitle text areas, right side with business imagery and icons for visual balance.


