Convergence Diagram - Project Direction Overview
RJ0600110_6
- Last Update 07/21/2025
- File Size 3.5MB
- # of Slides 2
- File Format PPTX
- Slide Ratio 16:9
- Color
Keywords
About the Product
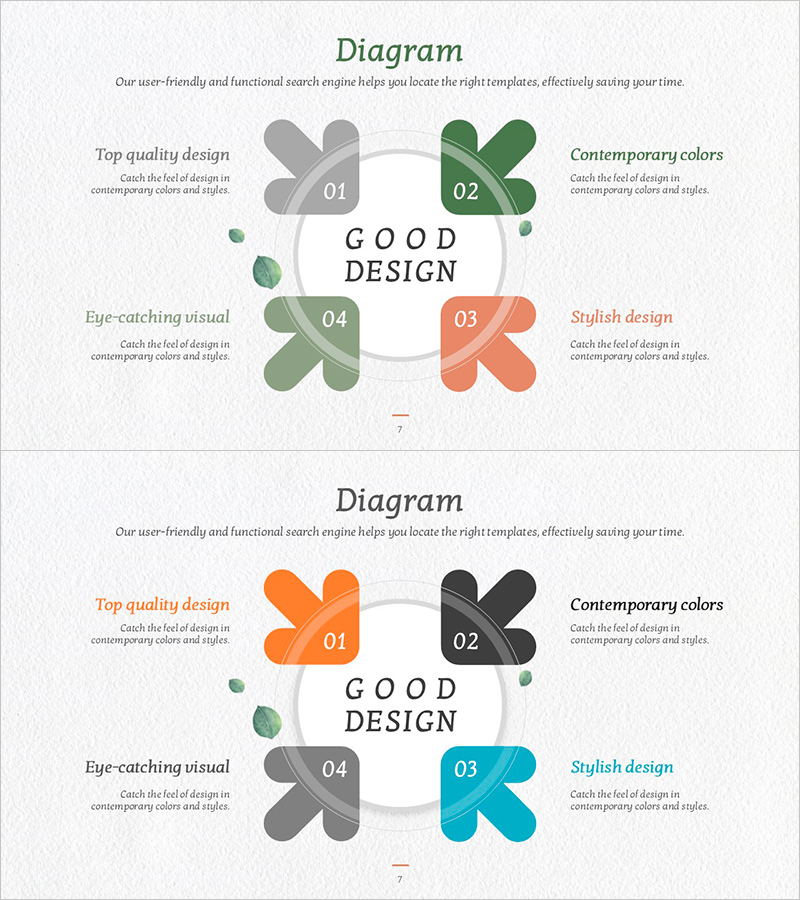
A four-directional convergence diagram PowerPoint slide where clover-shaped nodes in gray, green, orange, and cyan converge toward a central focal point. This slide effectively visualizes how multiple perspectives, departments, or viewpoints merge into a unified goal or decision. Ideal for project direction alignment, issue consolidation, and decision-making processes in presentations. The 2-slide set offers varied color combinations optimized for 16:9 widescreen format, making it easy to customize text fields for your specific content.
Usage Points
-
Main Usage
Visualizes how multiple viewpoints, departments, or inputs converge into a single central objective or conclusion. Clearly demonstrates the logical flow of strategy formulation and project direction decisions, helping audiences understand how diverse perspectives integrate into unified outcomes.
-
How to Use
Enter department names, opinions, or perspectives in each directional clover shape, and place the final conclusion or key direction in the central circle. Color differentiation makes each element distinct, and all text boxes are fully editable to match your presentation content and messaging.
-
Recommended For
Project managers, strategy planning teams, executive briefings, decision-making meetings, organizational restructuring announcements, and marketing strategy presentations. Particularly effective for bottom-up opinion consolidation, multi-department collaboration results integration, and strategic alternative evaluation scenarios.
-
Slide Structure
Two-slide set featuring four convergent nodes (gray, green, orange, cyan) flowing toward a central circular focal point. Each node contains an independent text input area, with the central circle designated for core messaging. The second slide provides alternative color combinations to adapt to different presentation contexts.
Related Products
-

Detailed Plan Schedule – Roadmap for Business Strategies
#Business Strategy #Business Management #Operational Plan
-

Internet Security Platform Structure Diagram – Stability and Innovation
#Business Strategy #Technical Approach #Diagram
-

Introduction to Operational Plans and Technology Section – Brief Background and Characteristics
#Operational Plan #Technical Approach #Diagram
-

Positioning Point Area Graph – Strategy for Market Analysis
#Market and Competitor Analysis #Marketing Plan and Strategy #Diagram
