History with Paper Texture Background – Visually Clean Diagram
RJ0600110_4
- Last Update 07/21/2025
- File Size 3.5MB
- # of Slides 2
- File Format PPTX
- Slide Ratio 16:9
- Color
Keywords
About the Product
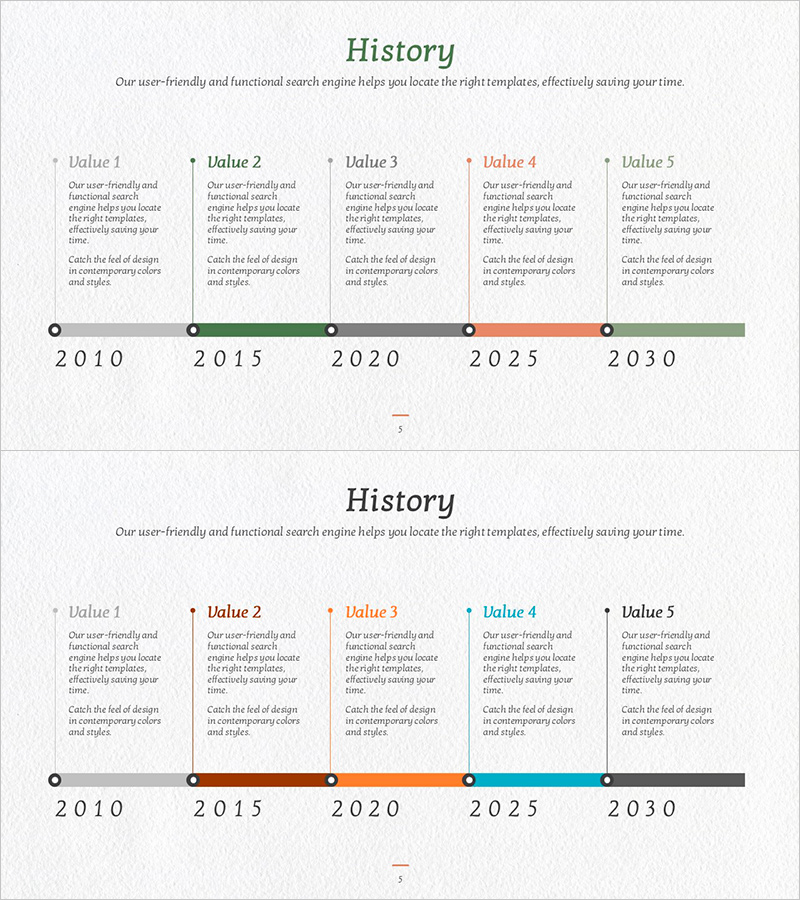
A 2-slide PowerPoint presentation featuring a 5-stage linear timeline diagram spanning from 2010 to 2030. This timeline slide template visualizes company history, project milestones, or product development roadmaps with dedicated text areas for titles and descriptions at each stage. The design incorporates a paper texture background with green and orange accent colors for visual emphasis. Available in 16:9 widescreen PPTX format, this timeline diagram is ready to use immediately in business presentations, annual reports, and strategic planning documents.
Usage Points
-
Main Usage
This timeline diagram presents key events, milestones, and achievements in chronological sequence. Ideal for showcasing company history, product development roadmaps, project phases, business expansion timelines, and any content where temporal progression is essential to understanding the narrative.
-
How to Use
Enter year or period labels in each stage's title text box and add corresponding descriptions in the explanation areas below. Use the color accent points to highlight specific milestones or turning points. The paper texture background provides a professional, polished appearance suitable for formal presentations.
-
Recommended For
Company introductions, business plan presentations, product development process explanations, marketing strategy pitches, investor relations (IR) presentations, educational seminars, organizational growth storytelling, and any presentation requiring emphasis on historical progression and achievements.
-
Slide Structure
Comprises 2 slides, each displaying a linear timeline diagram with 5 nodes representing key points from 2010 to 2030. Each node includes dedicated text input areas for titles and descriptions, with green and orange accent colors to emphasize specific stages or milestones.
Related Products
-

Marketing Mix 4P Square Diagram - Understanding Key Marketing Strategies
#Marketing Plan and Strategy #Diagram #Promotion Strategy
-

Step-by-step Marketing Strategy STEP5 – Visualizing Business Strategies
#Business Vision and Strategy #Marketing Plan and Strategy #Diagram
-

Brand Marketing Mix 4P Analysis Diagram
#Marketing Plan and Strategy #Diagram #Promotion Strategy
-

Award Certification Record Sheet – Achievements and Trust
#Company Introduction #Diagram #Awards and Certifications, and Patents
