Semicircular Graph – Modern Data Visualization
RJ0600110_24
- Last Update 07/21/2025
- File Size 3.3MB
- # of Slides 2
- File Format PPTX
- Slide Ratio 16:9
- Color
Keywords
About the Product
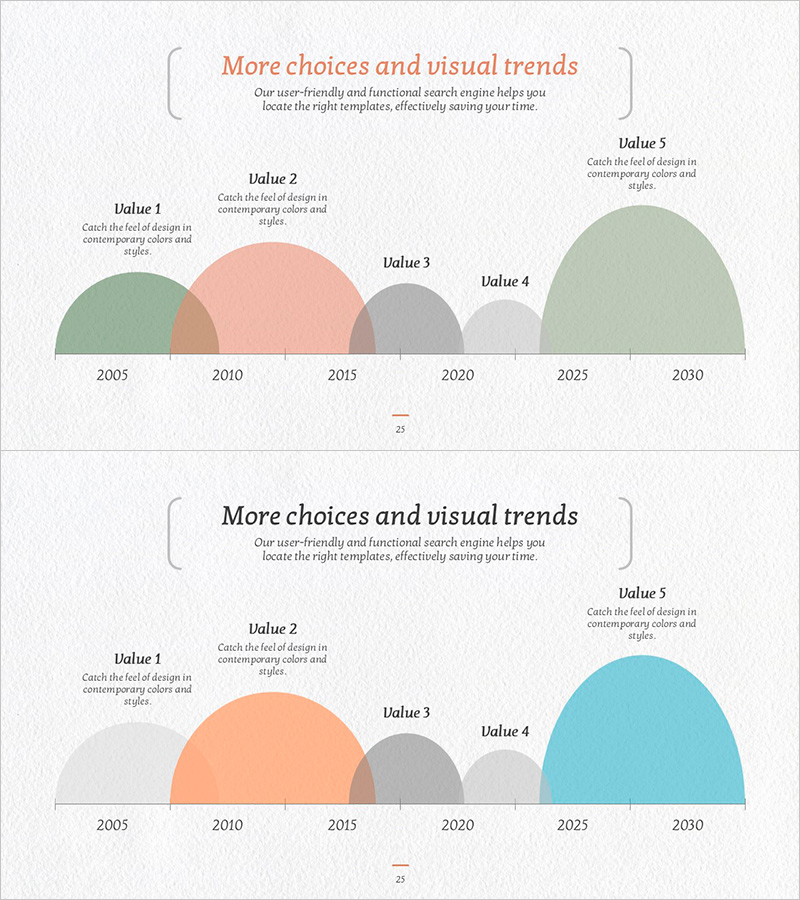
A two-slide PowerPoint template featuring semicircular graphs that visualize data changes from 2005 to 2030 across five distinct stages. Each semicircle is color-coded (green, pink, gray, light gray, and sage green) to establish clear visual hierarchy, with overlapping effects that intuitively convey temporal progression and data trends. This presentation slide is ideal for displaying time-series data such as trend analysis, growth phases, and market evolution in business reports and strategic presentations.
Usage Points
-
Main Usage
Visualize long-term data trends (2005–2030), market evolution, product growth phases, and technology roadmaps using semicircular graphs that emphasize temporal progression. This design helps audiences grasp multi-stage changes intuitively through overlapping color-coded arcs.
-
How to Use
Enter time intervals (2005, 2010, 2015, 2020, 2025, 2030) and corresponding data values above each semicircle. Customize colors to distinguish categories or phases as needed. Insert into business reports, strategy presentations, and market analysis documents to enhance data visualization sections.
-
Recommended For
Executive reports, investor presentations, marketing strategy briefings, market research analysis, product roadmap explanations, and annual performance reviews. Ideal for professionals (executives, analysts, marketers, consultants) who need to emphasize temporal change in data.
-
Slide Structure
Two-slide set: Slide 1 displays five semicircles (green, pink, gray, light gray, sage green) representing 2005–2030 in five stages with X-axis year labels for timeline clarity. Slide 2 offers an alternative color scheme (orange, gray, light gray, teal) with the same five-stage structure. Overlapping arcs emphasize temporal continuity.
Related Products
-

Annual Awards Introduction Slide – Showcase Key Achievements at a Glance
#Company Introduction #Diagram #Awards and Certifications, and Patents
-

Urban-Based Business Timeline Flow – Capturing Visual Changes
#Company Introduction #Business Management #Diagram
-

Triangle Pattern Wide Table PPT Template – Ideal for Company and Service Introduction
#Company Introduction #Product/Service Introduction #Diagram
-

Typographic Wide Template Flow Diagram1 – Business Operational Strategy
#Operational Plan #Technical Approach #Diagram
