Summer Template World Map – Global Network Visualization
RJ0600109_13
- Last Update 07/20/2025
- File Size 0.7MB
- # of Slides 2
- File Format PPTX
- Slide Ratio 16:9
- Color
Keywords
About the Product
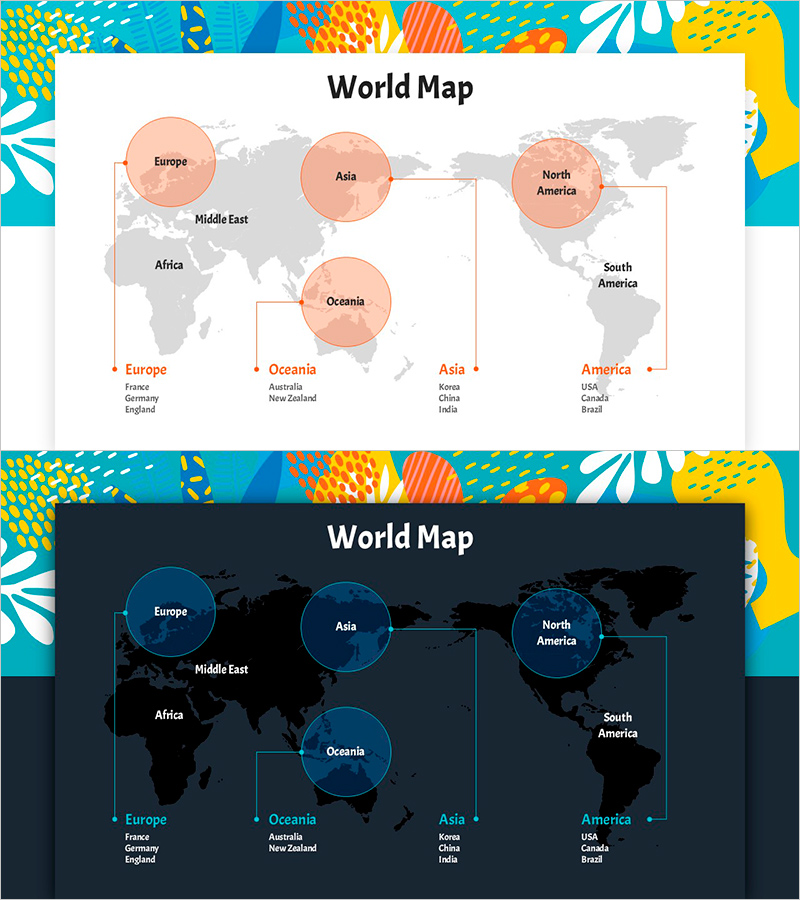
A world map PowerPoint slide featuring four continents (Europe, Asia, Oceania, Americas) represented as circular nodes with connecting lines to visualize global networks. Two design versions are provided: light beige and dark blue backgrounds. Each region displays key countries as text labels, making it ideal for international business presentations, global strategy discussions, and overseas expansion briefings. The colorful pattern border and world map graphic enhance the professional appearance. Ready-to-edit 2-slide set for immediate use.
Usage Points
-
Main Usage
Visualizes global business strategies, international partnerships, and overseas expansion plans by region. The four circular nodes represent continents with connecting lines showing relationships and interdependencies. Easily add company names, branch offices, or partner information to create detailed market analysis presentations.
-
How to Use
Open the slide and edit the circular node text to insert company names, office locations, or partner details. Adjust connecting line colors and thickness to represent relationship strength. Customize background colors to match corporate branding. Use as a slide in global strategy presentations, investor briefings, and international partnership introductions.
-
Recommended For
Ideal for executives, marketing teams, and strategic planning departments at global corporations presenting international business status. Perfect for overseas branch introductions, global supply chain structures, international collaboration networks, and multinational project updates. Suitable for consulting firms, trading companies, and international development organizations.
-
Slide Structure
2-slide set: Slide 1 features light beige background with 4 circular regional nodes (Europe, Asia, Oceania, Americas), connecting lines, and 3-4 country names per region. Slide 2 uses dark blue background with identical structure. Semi-transparent world map graphic in background emphasizes regional locations.
Related Products
-

Global Destination Network Map Slide for Business Trips
#Company Introduction #Diagram #Other
-

Global Target Country Analysis Slide
#Company Introduction #Marketing Plan and Strategy #Diagram
-

Building Infrastructure Slide – Efficient Connection and Global Network
#Company Introduction #Business Introduction #Diagram
-

Global Infrastructure Slide – Visualizing Global Networks
#Company Introduction #Business Introduction #Diagram
